P2P Payment Usage Statistics: 2026 Report

People now send money to friends, family, and small businesses through apps and bank tools, often in place of cash or a check. Zelle moves the money between bank accounts. Venmo, Cash App, and PayPal can also hold a balance in the app. These tools are widely used, but they do not reach every age or income group in the same way, so we looked at who uses which one.
Our analysts reviewed the Federal Reserve Bank of Atlanta's 2025 Survey and Diary of Consumer Payment Choice, a survey of 6,079 consumers conducted in October 2025, and measured 12-month use of PayPal, Zelle, Venmo, and Cash App from the public microdata, as of Q4 2026. We also reviewed Zelle's published 2025 volumes, Block's 2025 annual report for Cash App, and the Federal Trade Commission's 2024 Consumer Sentinel Network Data Book for scam losses reported on payment apps. Of the four apps, 69.7% of consumers had used at least one in the past 12 months.
In the following sections, we compare how use of each app has changed since 2019, how use differs by age, and how it differs by household income.
Key Findings
- Venmo was used by 34.6% of consumers in the 12 months to October 2025, just ahead of Zelle at 33.2% and PayPal at 32.5%. Cash App was used by 21.2%.
- Use falls with age. Among consumers aged 18 to 29, 82.4% used at least one of the four apps, compared with 44.9% of consumers aged 70 and older.
- Venmo use rises with income, from 10.5% of consumers in households earning less than $25,000 to 61.0% in households earning $150,000 or more. Cash App moves in the opposite direction, from 33.7% to 13.5%.
- The FTC's 2024 Consumer Sentinel Network Data Book recorded 90,571 fraud reports involving a payment app or service, with $391 million in losses.
Venmo Now Leads, While PayPal's Share Has Fallen
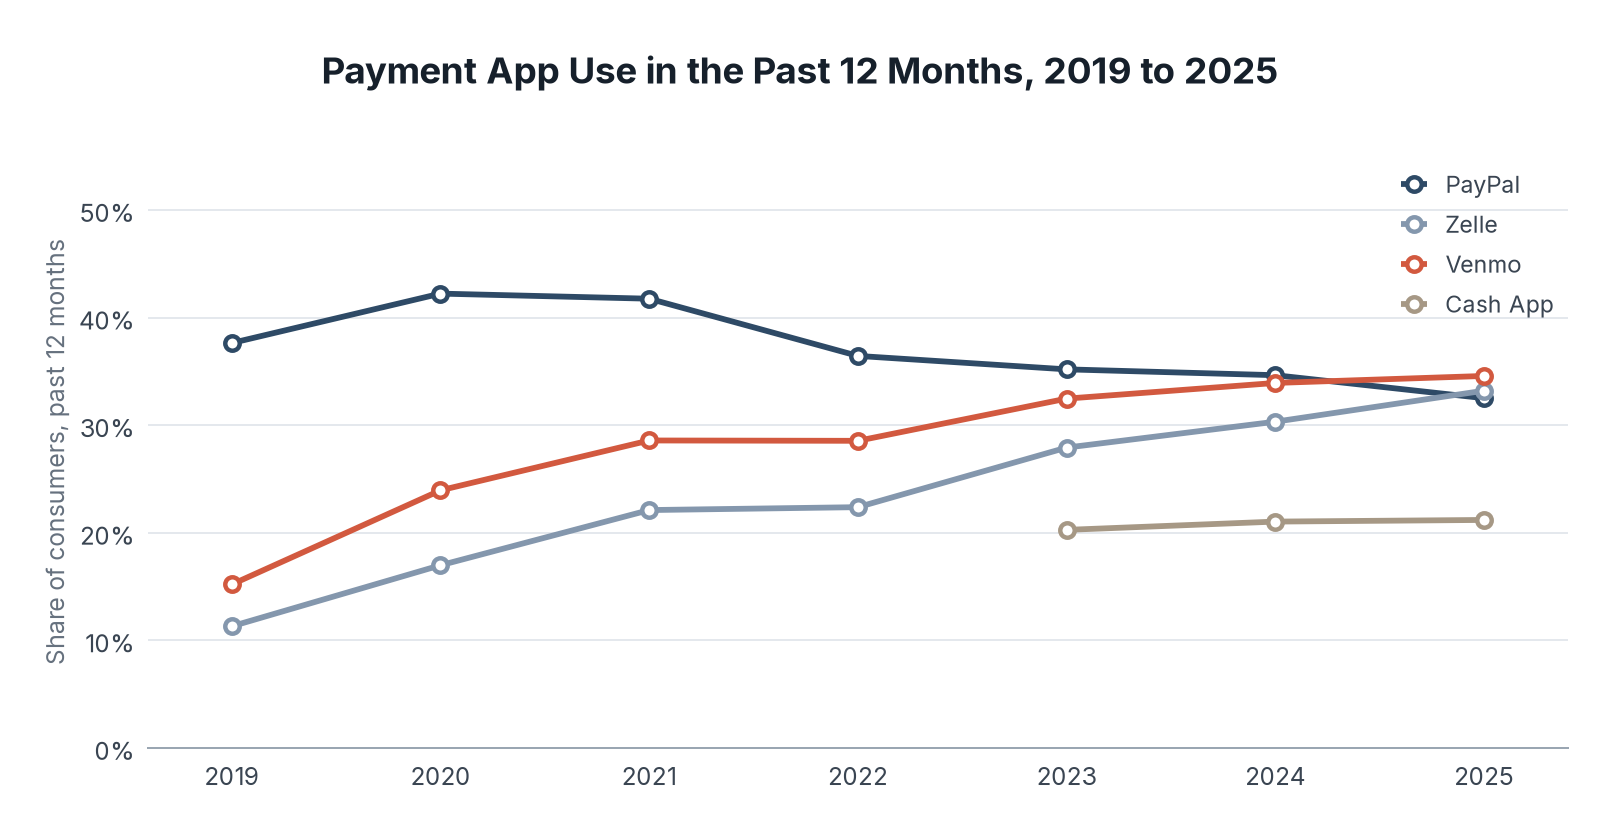
In 2019, PayPal was the most used of the four apps, at 37.6% of consumers. Zelle stood at 11.3% and Venmo at 15.2%. By 2025, Venmo had reached 34.6% and Zelle 33.2%, while PayPal had fallen to 32.5%. Cash App, which the survey first reported separately in 2023, was little changed, at 21.2% in 2025 after 20.3% in 2023.
The question asks whether the consumer used the app in the past 12 months to make a purchase or pay another person, so the figures include shopping as well as person-to-person payments.
| Year | PayPal | Zelle | Venmo | Cash App |
|---|---|---|---|---|
| 2019 | 37.6% | 11.3% | 15.2% | n/a |
| 2020 | 42.2% | 17.0% | 23.9% | n/a |
| 2021 | 41.8% | 22.1% | 28.6% | n/a |
| 2022 | 36.4% | 22.4% | 28.6% | n/a |
| 2023 | 35.2% | 27.9% | 32.5% | 20.3% |
| 2024 | 34.6% | 30.3% | 33.9% | 21.0% |
| 2025 | 32.5% | 33.2% | 34.6% | 21.2% |
Key Findings
- Zelle's 12-month use nearly tripled from 11.3% in 2019 to 33.2% in 2025.
- PayPal's share peaked at 42.2% in 2020 and has fallen in every year since 2021.
- 30.3% of consumers used none of the four apps in the 12 months to October 2025, and 12.5% used three or all four.
Younger Consumers Lean on Venmo and Zelle
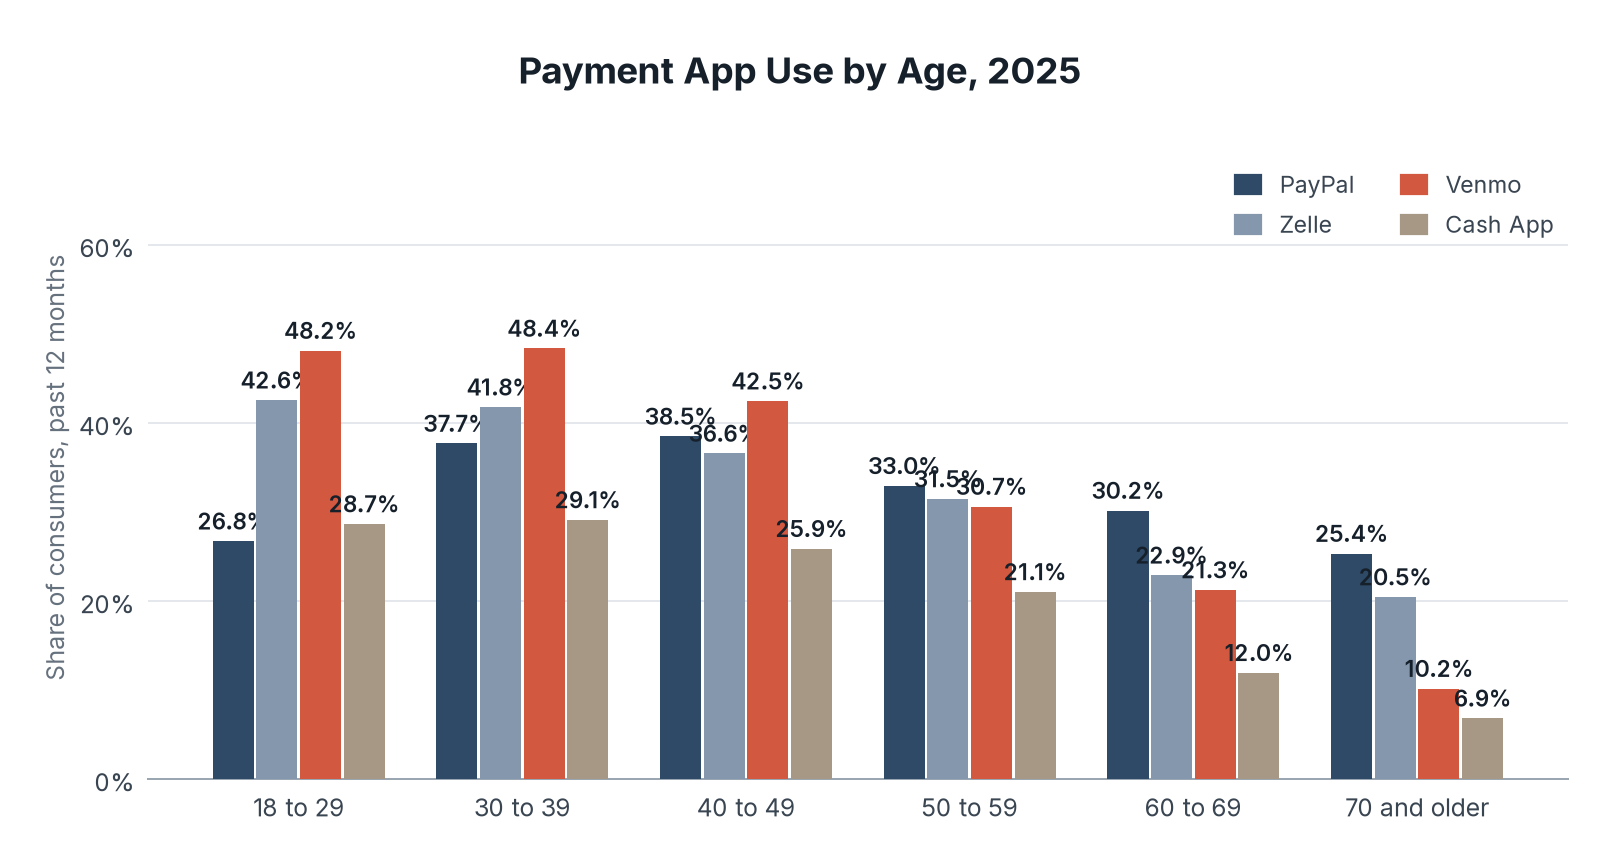
Use of at least one of the four apps is high through the 40s, then falls. Venmo is the most used app among consumers under 50. From age 60, PayPal leads, and Cash App use drops sharply.
A separate question asked whether the consumer had used a mobile phone or tablet to pay or give money to another person in the past 12 months. That share was 46.4% overall, and 62.1% among consumers aged 18 to 29.
| Age | Any of the four | PayPal | Zelle | Venmo | Cash App |
|---|---|---|---|---|---|
| 18 to 29 | 82.4% | 26.8% | 42.6% | 48.2% | 28.7% |
| 30 to 39 | 82.8% | 37.7% | 41.8% | 48.4% | 29.1% |
| 40 to 49 | 79.6% | 38.5% | 36.6% | 42.5% | 25.9% |
| 50 to 59 | 67.3% | 33.0% | 31.5% | 30.7% | 21.1% |
| 60 to 69 | 55.2% | 30.2% | 22.9% | 21.3% | 12.0% |
| 70 and older | 44.9% | 25.4% | 20.5% | 10.2% | 6.9% |
Key Findings
- Among consumers aged 70 and older, PayPal use was more than twice Venmo use, at 25.4% compared with 10.2%.
- Cash App use among consumers aged 18 to 29 was 28.7%, four times the 6.9% rate among consumers aged 70 and older.
- The gap between the youngest and oldest groups is widest for Venmo, at 38 percentage points.
Cash App Is Most Common at Lower Incomes, Venmo at Higher Incomes
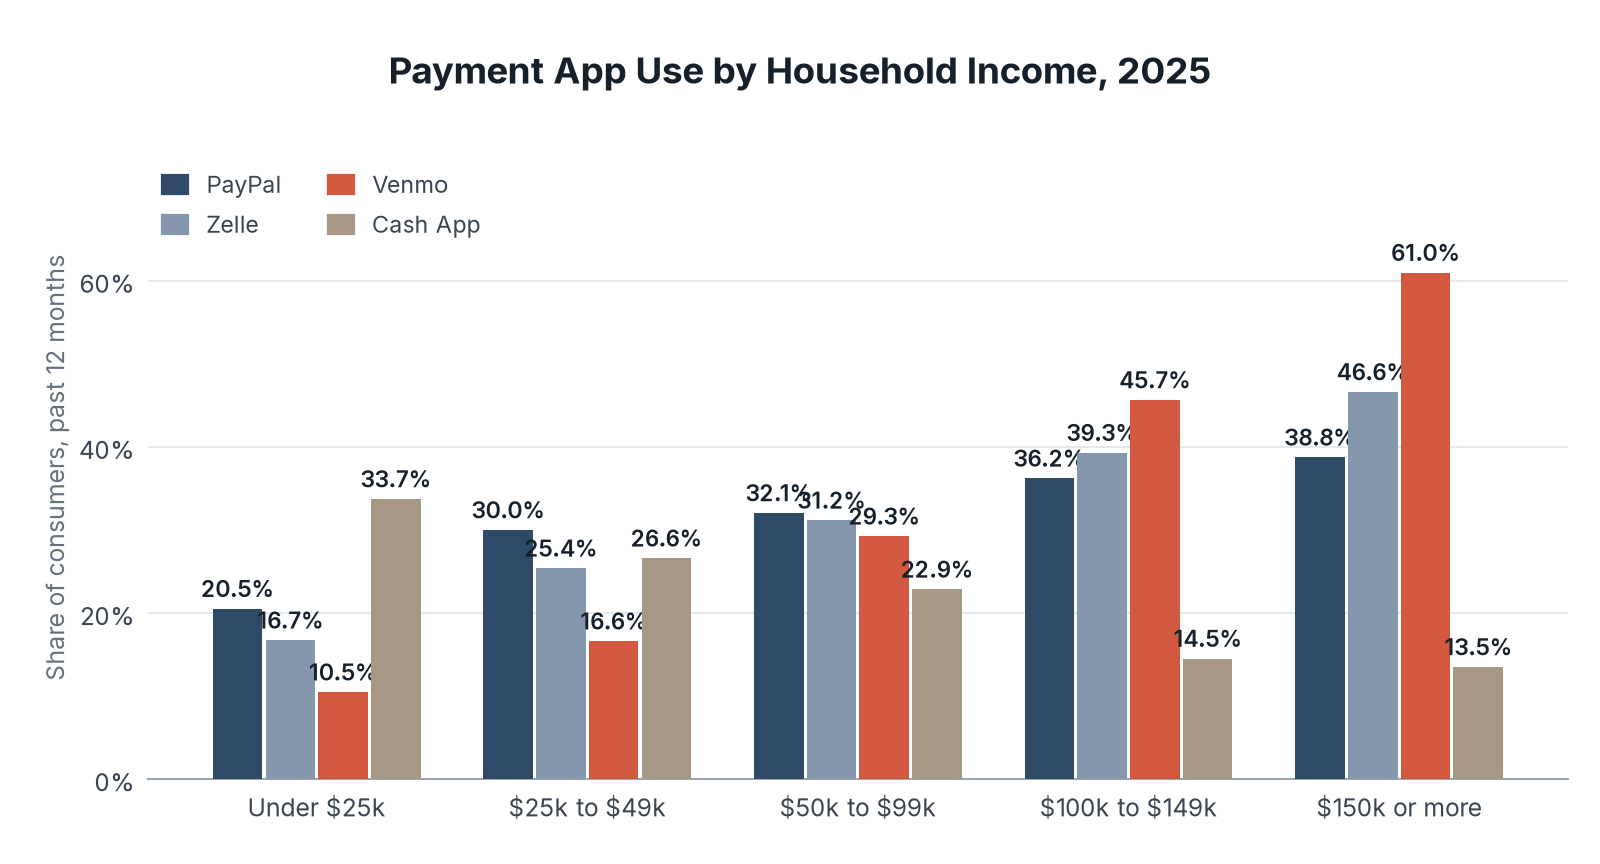
Household income splits the four apps more sharply than age does. Consumers in lower-income households are more likely to use Cash App than any of the other three. Consumers in higher-income households are much more likely to use Venmo and, to a lesser extent, Zelle.
The share who used at least one of the four apps still rises with income, from 54.5% in households earning less than $25,000 to 83.8% in households earning $150,000 or more.
| Household income | Any of the four | PayPal | Zelle | Venmo | Cash App |
|---|---|---|---|---|---|
| Less than $25,000 | 54.5% | 20.5% | 16.7% | 10.5% | 33.7% |
| $25,000 to $49,999 | 60.2% | 30.0% | 25.4% | 16.6% | 26.6% |
| $50,000 to $99,999 | 67.1% | 32.1% | 31.2% | 29.3% | 22.9% |
| $100,000 to $149,999 | 76.7% | 36.2% | 39.3% | 45.7% | 14.5% |
| $150,000 or more | 83.8% | 38.8% | 46.6% | 61.0% | 13.5% |
Key Findings
- Venmo use is nearly six times as high in the top income group as in the bottom group, at 61.0% compared with 10.5%.
- Cash App is the only one of the four apps whose use is highest in the lowest income group.
- Zelle use also rises with income, from 16.7% below $25,000 to 46.6% at $150,000 or more, but the spread is narrower than Venmo's.
Volumes Are Large, and So Are Reported Scam Losses
Official volume figures are not directly comparable across networks, because each company counts a different set of payments. They do show that these tools move a great deal of money.
Zelle said consumers and small businesses sent more than $1.2 trillion on its network in 2025, up 20% from a year earlier, across 4.2 billion transactions. In December 2025, 100 million bank and credit union accounts used Zelle. Small businesses accounted for $357 billion of the 2025 total. Block reported that Cash App had 59 million monthly transacting actives as of December 2025 and $316 billion of inflows during the year. Inflows include money brought into Cash App, not only person-to-person payments. PayPal's total payment volume, which includes checkout and other payments beyond person-to-person transfers, was $1.79 trillion in 2025.
Scam losses on these tools are also large. In the FTC's Consumer Sentinel Network Data Book for 2024, published in March 2025, consumers reported 90,571 fraud cases that involved a payment app or service, with $391 million in losses. That was the second most common payment method in those fraud reports, after credit cards, which appeared in 108,881 reports with $275 million in losses. Bank transfers, a separate category, accounted for fewer reports and a much larger dollar loss, at $2.09 billion. The FTC figures include only reports in which the consumer said they lost between $1 and $999,999, and they are not limited to Zelle, Venmo, Cash App, or PayPal.
What This Means for People Who Send and Receive Money
These apps are now a regular way for many adults to pay a person or a small business. They are not a single market. Younger adults and higher-income households lean on Venmo and Zelle. Cash App has a larger role in lower-income households. PayPal remains widely used, especially among older adults, even as its share has declined.
The dollar volumes show why scams on these tools get so much attention. A payment that posts in minutes is hard to reverse. The FTC data are a year older than the usage survey, and they do not isolate each app, but they show that payment-app fraud is common and costly.
So if you use one of these apps, treat a request from someone you do not know as you would a request to wire money, and confirm the recipient before you hit send.
Data Collection and Methodology
We reviewed sources available in Q4 2026. The usage figures come from the Federal Reserve Bank of Atlanta's 2025 Survey and Diary of Consumer Payment Choice, which interviewed 6,079 consumers in October 2025. Table 1 reports the official weighted estimates from the study's published Table 1, "Ownership of Accounts and Adoption of Account Access Technologies." The 2025 "any of the four" figures, the counts of how many of the four apps a consumer used, the mobile person-to-person question, and the breakdowns by age and household income are our weighted estimates from the public individual-level microdata, using the survey's individual weight. They match the official 2025 totals for each app. Age groups are based on the respondent's age. Income groups collapse the survey's household income categories. Cash App was not reported separately before 2023, and Zelle and Venmo were not reported before 2019. Network volumes are the figures published by Zelle (Early Warning Services) for 2025, by Block for Cash App in its 2025 Form 10-K, and by PayPal for total payment volume in its 2025 results. Those volume measures are defined differently and are not comparable to one another. Scam-loss figures come from the Federal Trade Commission's Consumer Sentinel Network Data Book 2024, the latest edition, for the "Payment App or Service" payment method. Credit unions and other payment apps are outside the four-app usage tables.
Sources
- Fintech Index, P2P Payment Usage Study: analysis of Atlanta Fed payments diary microdata on 12-month use of Zelle, Venmo, Cash App, and PayPal, plus official network volumes and FTC fraud reports, conducted November 2026.
- Federal Reserve Bank of Atlanta, 2025 Survey and Diary of Consumer Payment Choice
- Federal Reserve Bank of Atlanta, 2025 SDCPC tables
- Federal Reserve Bank of Atlanta, 2025 SDCPC public microdata
- Zelle, Zelle Posts 20% Growth with $1.2 Trillion Sent, February 11, 2026
- Block, Inc., Form 10-K for the year ended December 31, 2025
- PayPal Holdings, Inc., Fourth Quarter and Full Year 2025 Results, February 3, 2026
- Federal Trade Commission, Consumer Sentinel Network Data Book 2024, March 2025
- Table 1: Source: Federal Reserve Bank of Atlanta, 2025 Survey and Diary of Consumer Payment Choice, Table 1. Data: atlantafed_sdcpc_p2p_adoption_2015_2025.csv
- Chart 1: Source: Federal Reserve Bank of Atlanta, 2025 Survey and Diary of Consumer Payment Choice, Table 1.
- Table 2: Source: Fintech Index analysis of the Federal Reserve Bank of Atlanta, 2025 Survey and Diary of Consumer Payment Choice public microdata. Data: atlantafed_sdcpc_p2p_adoption_by_age_2025.csv
- Chart 2: Source: Fintech Index analysis of the Federal Reserve Bank of Atlanta, 2025 Survey and Diary of Consumer Payment Choice public microdata.
- Table 3: Source: Fintech Index analysis of the Federal Reserve Bank of Atlanta, 2025 Survey and Diary of Consumer Payment Choice public microdata. Data: atlantafed_sdcpc_p2p_adoption_by_income_2025.csv
- Chart 3: Source: Fintech Index analysis of the Federal Reserve Bank of Atlanta, 2025 Survey and Diary of Consumer Payment Choice public microdata.