Fintech Time to Profitability Statistics: 2026 Report
How long does it take a fintech to start making money? We followed venture-backed fintechs founded from 2010 to 2021 to find when each had its first profitable year.

Most venture-backed fintechs lose money for years before they earn more than they spend, and investors fund the losses until then. How long that takes differs widely. A lender earns interest from its first loan, while a digital bank may need close to a decade and hundreds of millions of dollars before it breaks even. We wanted to know how long the typical fintech takes and what shortens the wait.
Our analysts followed 636 venture-backed fintechs founded between 2010 and 2021. Of those, 247 have reached profitability, which we define as the first full fiscal year of positive EBITDA. For each, we recorded the years from founding to that point and the equity raised along the way. Across all 247, the median time to profitability is 6.1 years.
Below, we break that figure down by segment, capital raised, founding year and revenue scale, and identify the business characteristics that shortened or lengthened the path.
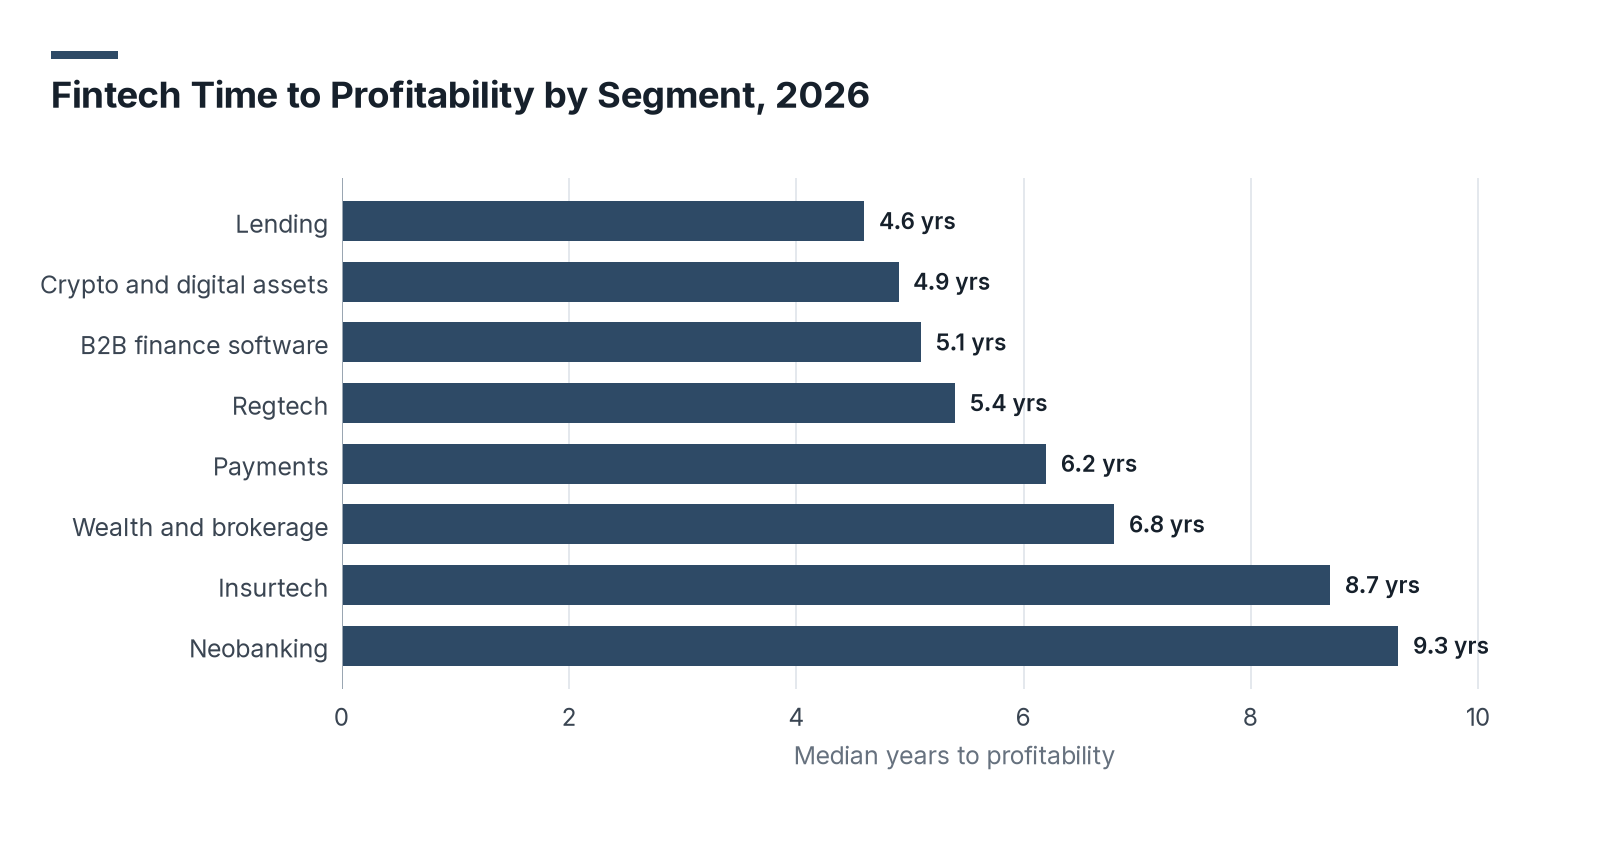
Median Years to Profitability by Fintech Segment
The table below shows the median number of years from founding to the first full year of positive EBITDA in each segment, along with the median equity raised before breakeven.
| Segment | Profitable Companies Analyzed | Median Years to Profitability | Median Equity Raised Before Breakeven |
|---|---|---|---|
| Lending | 38 | 4.6 years | $85M |
| Crypto and digital assets | 25 | 4.9 years | $71M |
| B2B finance software | 41 | 5.1 years | $38M |
| Regtech | 22 | 5.4 years | $44M |
| Payments | 44 | 6.2 years | $96M |
| Wealth and brokerage | 27 | 6.8 years | $120M |
| Insurtech | 19 | 8.7 years | $212M |
| Neobanking | 31 | 9.3 years | $310M |
- Lending companies reach profitability fastest, at a median 4.6 years, because loans generate interest income from the first dollar originated.
- Neobanks take a median 9.3 years, 2.0 times as long as lenders, and raise a median $310 million in equity before breaking even.
- Segment sets both the timeline and the capital needed to break even. Neobanks take a median 9.3 years and $310 million, against 5.1 years and $38 million for B2B software.
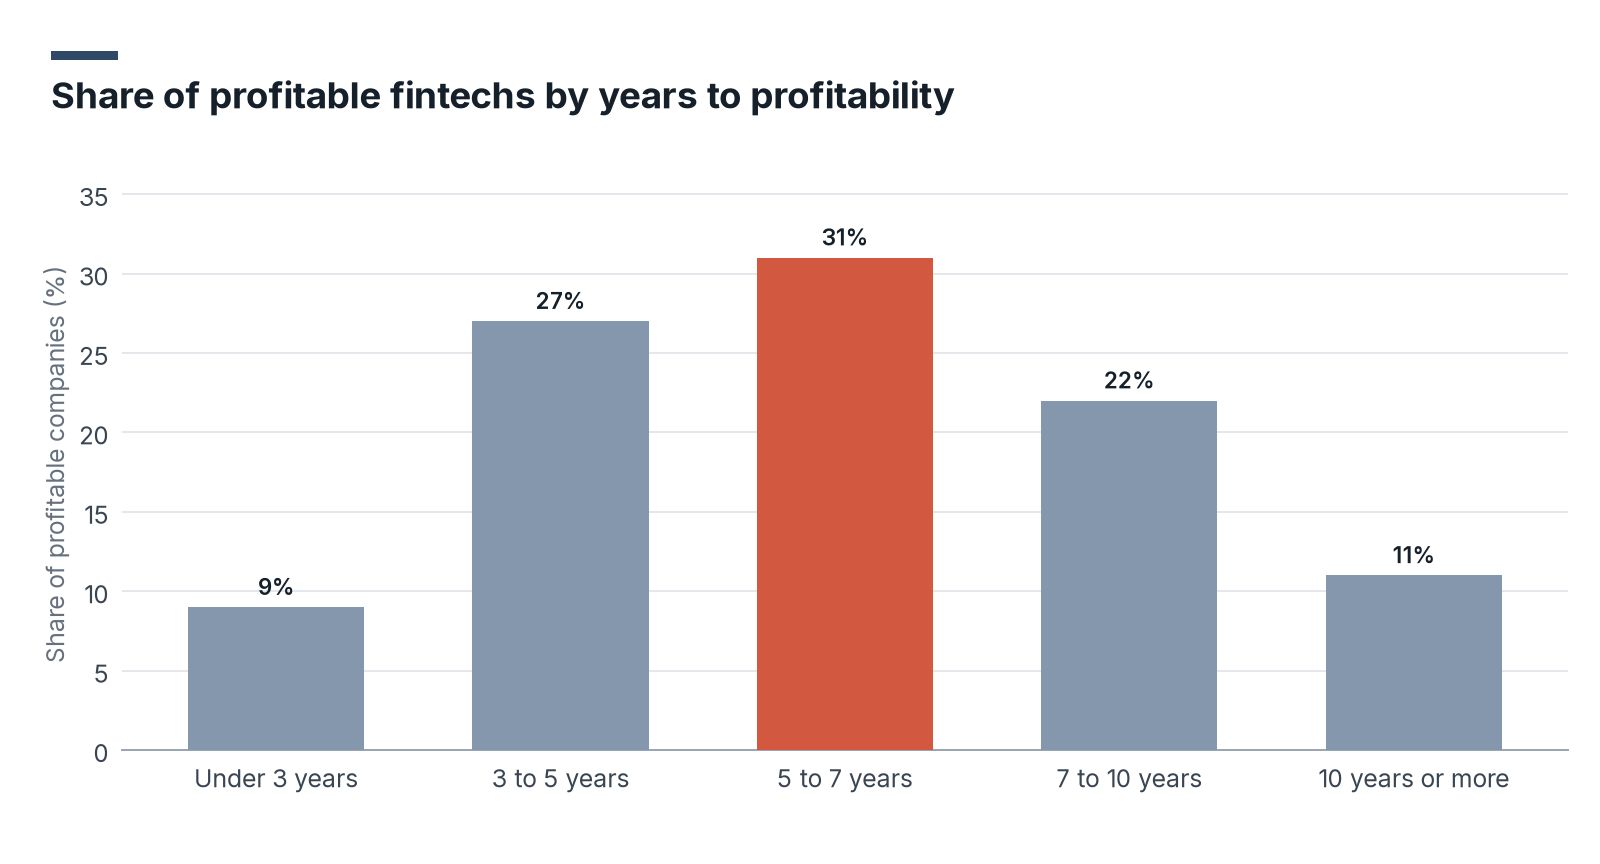
Distribution of Time to Profitability
The table below shows how the 247 profitable companies in our dataset are distributed across ranges of years to profitability.
| Years from Founding to Profitability | Companies | Share of Profitable Companies |
|---|---|---|
| Under 3 years | 22 | 9% |
| 3 to 5 years | 67 | 27% |
| 5 to 7 years | 77 | 31% |
| 7 to 10 years | 54 | 22% |
| 10 years or more | 27 | 11% |
- 36% of profitable fintechs got there in under five years.
- Most fintechs that reach profitability take five years or more. 36% got there in under five years, while 33% took seven or more.
- One in three (33%) took seven years or more, and 11% took a decade or longer.
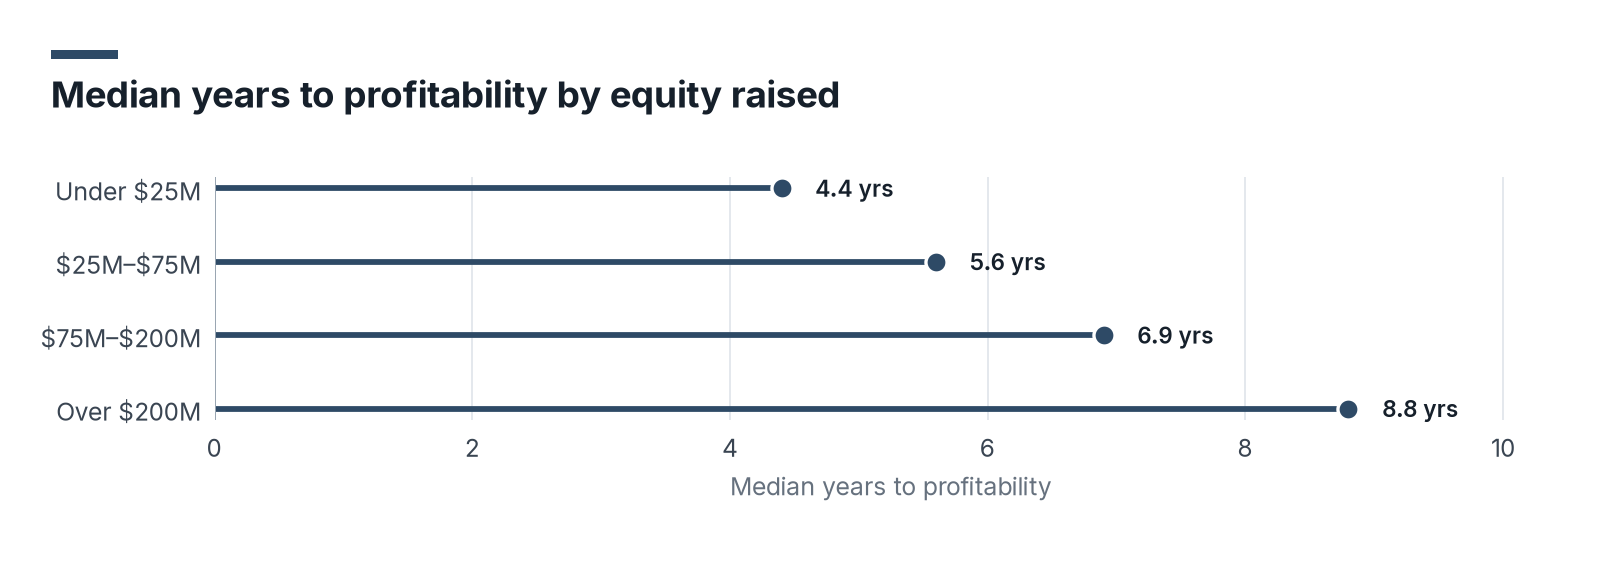
Time to Profitability by Capital Raised
In the table below, we group profitable companies by the total equity they raised before reaching breakeven.
| Equity Raised Before Breakeven | Companies | Share of Profitable Companies | Median Years to Profitability |
|---|---|---|---|
| Under $25M | 59 | 24% | 4.4 years |
| $25M-$75M | 82 | 33% | 5.6 years |
| $75M-$200M | 64 | 26% | 6.9 years |
| Over $200M | 42 | 17% | 8.8 years |
| Equity Raised | Median Years |
|---|---|
| Under $25M | 4.4 yrs |
| $25M-$75M | 5.6 yrs |
| $75M-$200M | 6.9 yrs |
| Over $200M | 8.8 yrs |
- Companies that raised under $25 million reached profitability in a median 4.4 years, half the 8.8 years for companies that raised more than $200 million.
- 57% of profitable fintechs raised $75 million or less before breaking even.
- Raising more money does not speed up profitability. Companies that raised under $25 million broke even in 4.4 years, half the 8.8 years for those raising over $200 million.
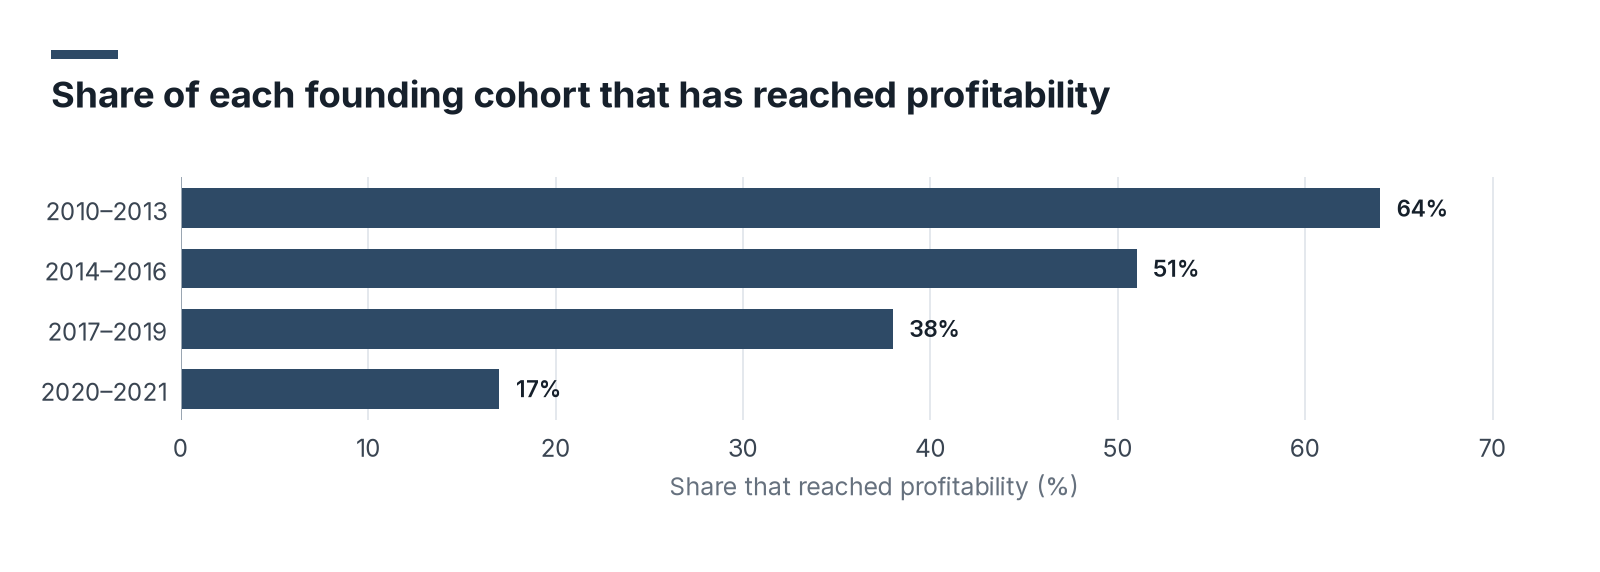
Profitability by Founding Cohort
The table below shows, for each founding cohort, how many companies we tracked, how many have reached profitability, and the median years it took those that did.
| Founding Years | Companies Tracked | Reached Profitability | Share Profitable | Median Years to Profitability |
|---|---|---|---|---|
| 2010-2013 | 92 | 59 | 64% | 7.4 years |
| 2014-2016 | 148 | 75 | 51% | 6.6 years |
| 2017-2019 | 218 | 83 | 38% | 5.3 years |
| 2020-2021 | 178 | 30 | 17% | 3.9 years |
- 64% of fintechs founded from 2010 to 2013 have reached profitability, compared with 38% of the 2017 to 2019 cohort.
- The 3.9-year median for the 2020 to 2021 cohort reflects only its fastest companies, since slower ones have not yet had time to reach breakeven.
- Only a minority of fintechs ever turn a profit. Across 636 companies tracked, 39% have reached profitability, and 38% of the 2017 to 2019 cohort have done so.
Revenue Scale at Breakeven
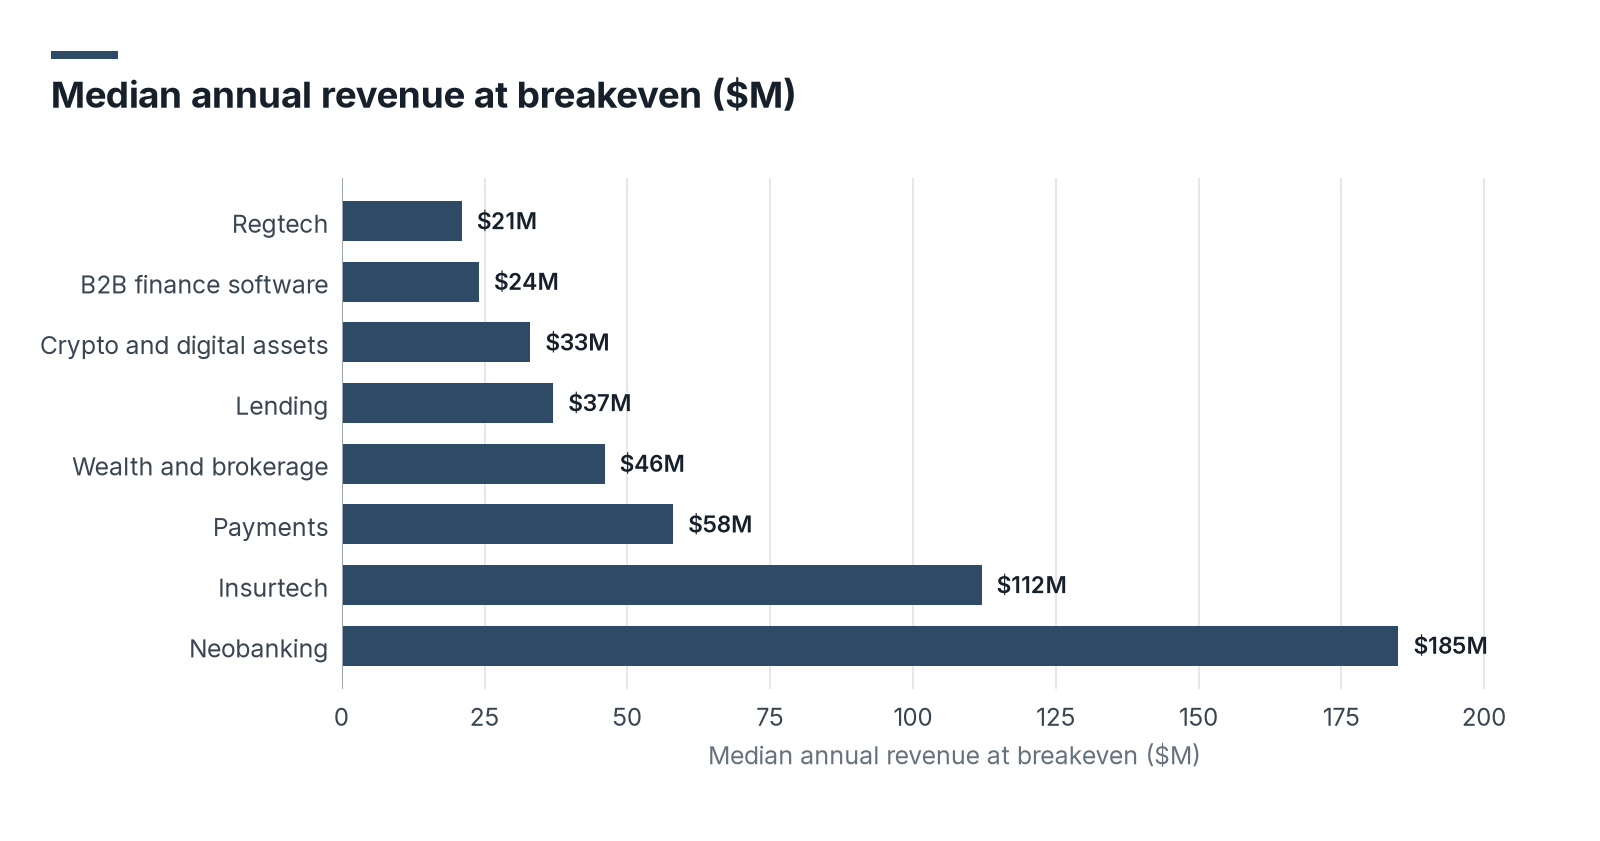
How much revenue does a fintech need before it turns profitable? The table below shows median annual revenue and gross margin in the first profitable year, by segment.
| Segment | Median Annual Revenue in First Profitable Year | Median Gross Margin in First Profitable Year |
|---|---|---|
| Regtech | $21M | 70% |
| B2B finance software | $24M | 72% |
| Crypto and digital assets | $33M | 61% |
| Lending | $37M | 44% |
| Wealth and brokerage | $46M | 63% |
| Payments | $58M | 52% |
| Insurtech | $112M | 36% |
| Neobanking | $185M | 47% |
- Regtech and B2B finance software companies break even at a median $21 million and $24 million in revenue, supported by gross margins of 70% and 72%.
- Neobanks need a median $185 million in revenue to break even, almost 8 times the B2B finance software figure.
- The revenue needed to break even varies by almost eight times across segments. Neobanks need a median $185 million, against $24 million for B2B software.
What Speeds Up or Slows Down Profitability
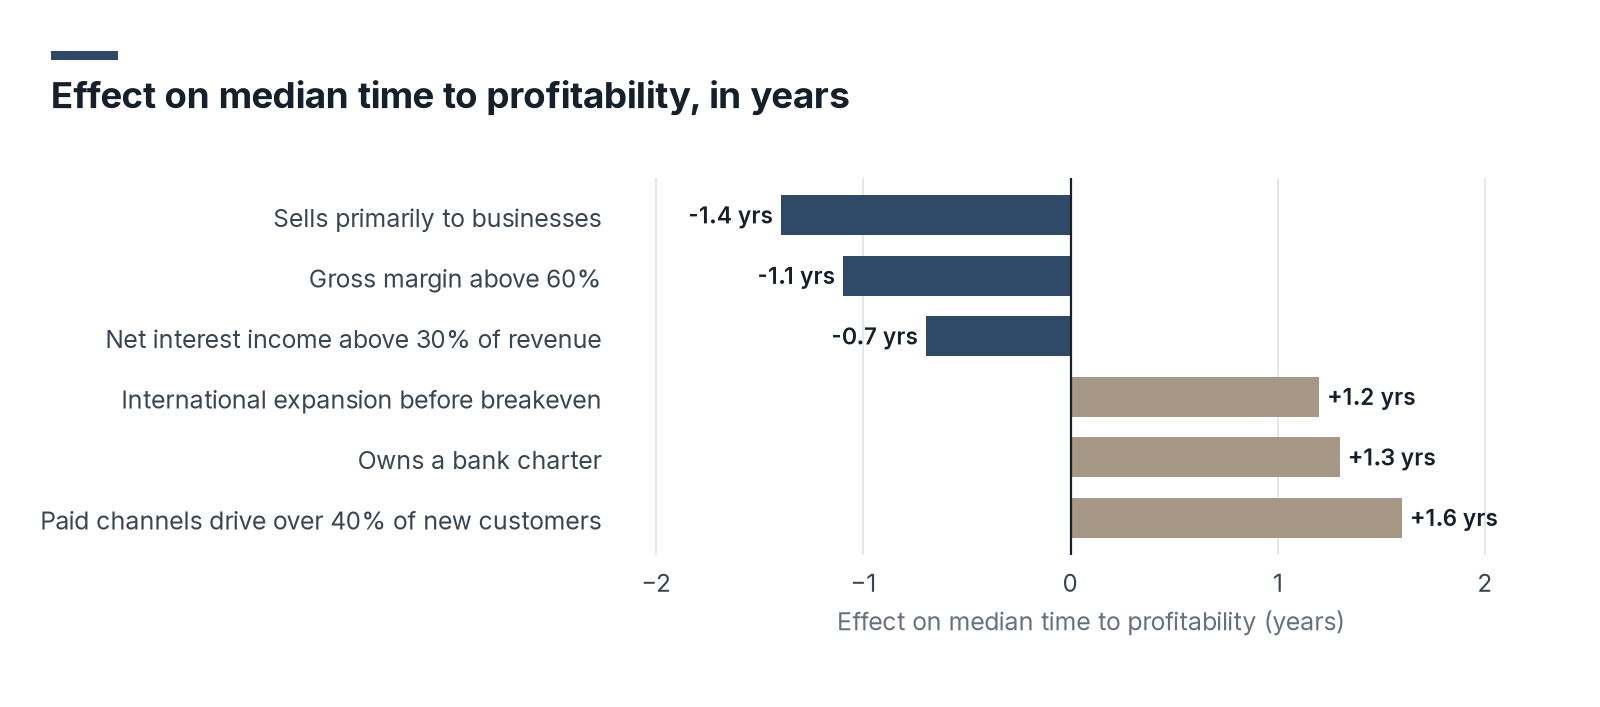
We measured how each characteristic below changed the median time to profitability, comparing companies with and without it within the same segment. Negative values mean a faster path.
| Company Characteristic | Share of Profitable Companies | Effect on Median Time to Profitability |
|---|---|---|
| Sells primarily to businesses | 48% | -1.4 years |
| Gross margin above 60% | 44% | -1.1 years |
| Net interest income above 30% of revenue | 21% | -0.7 years |
| International expansion before breakeven | 29% | +1.2 years |
| Owns a bank charter | 7% | +1.3 years |
| Paid channels drive over 40% of new customers | 33% | +1.6 years |
| Company Characteristic | Effect |
|---|---|
| Sells primarily to businesses | -1.4 years |
| Gross margin above 60% | -1.1 years |
| Net interest income above 30% of revenue | -0.7 years |
| International expansion before breakeven | +1.2 years |
| Owns a bank charter | +1.3 years |
| Paid channels drive over 40% of new customers | +1.6 years |
- Selling primarily to businesses shortened the path by 1.4 years, the largest reduction we measured.
- Relying on paid channels for more than 40% of new customers added 1.6 years, the largest delay we measured.
- A few choices shift the timeline by more than a year. Selling to businesses cut 1.4 years, while relying on paid channels for over 40% of customers added 1.6 years. Founders can shorten their path by favoring B2B sales and organic growth.
What Fintech Time to Profitability Trends Mean for 2027 and Beyond
Most venture-backed fintechs have never turned a profit, and those that did took years to get there. More money did not shorten the wait. The business itself mattered more: companies that sold to businesses and spent less on paid marketing got there sooner than consumer apps that bought their growth.
The youngest companies in this study look fast only because the slower ones have not finished yet, so their path is still ahead of them. With investors rewarding efficiency, companies that keep raising large rounds to pay for growth could face a longer and costlier road to profit than lean ones.
So if you're building toward profitability, track how much of your growth comes from paid channels, and bring that share down before you raise more.
Sources
- Entrepreneurial, Institutional and Financial Strategies for FinTech Profitability. Financial Innovation, February 2022.
- A Closer Look at Public Fintech Health and Efficiency. Flagship Advisory Partners, October 2025.
- The Fintech Entrepreneur's Guide to Creating Enterprise Value Starts with Contribution Profit. Bessemer Venture Partners, September 2024.
- Fintechs That Raked in Profits from High Interest Rates Now Face Resilience Test. CNBC via NBC4 Washington, May 2025.