Fintech M&A Valuation Multiples: 2026 Report
What are fintech companies selling for when they are bought? We tracked fintech acquisitions since 2022 and compared the prices paid with each company's revenue and earnings.

When a fintech company is sold, the price is often described as a multiple of its yearly revenue, which makes deals of different sizes easier to compare. Buyers pay far more for fast-growing companies than for slow ones. So we looked at what drives the price a fintech sells for.
Our analysts studied 638 fintech deals with disclosed or reliably estimated terms that closed from the first half of 2022 through the first half of 2026. For each deal, we calculated enterprise value (EV) as a multiple of the target's trailing twelve-month revenue and, where the target was profitable, its EBITDA.
The results below show multiples by segment, growth rate, buyer type and deal size, how multiples have moved since 2022, and which deal characteristics raised or lowered the price.
Median Valuation Multiples by Fintech Segment
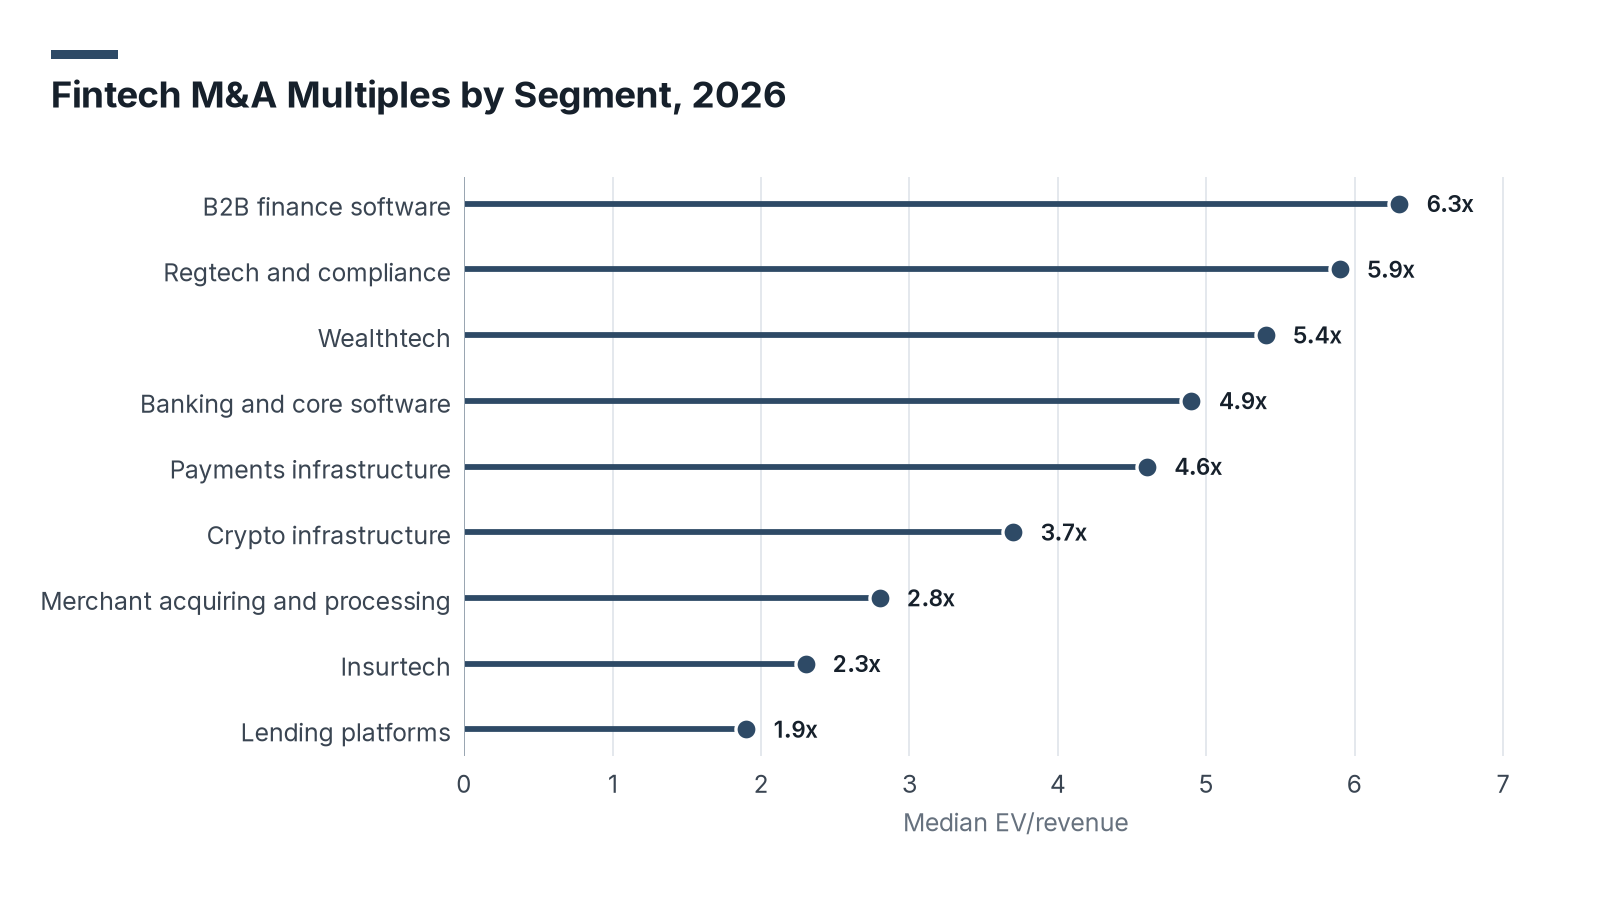
The table below shows median EV/revenue and EV/EBITDA multiples by segment for the 125 deals in our dataset that closed in the most recent twelve months.
| Segment | Deals, Trailing 12 Months | Median EV/Revenue | Median EV/EBITDA |
|---|---|---|---|
| B2B finance software | 17 | 6.3x | 24.5x |
| Regtech and compliance | 12 | 5.9x | 21.7x |
| Wealthtech | 14 | 5.4x | 19.8x |
| Banking and core software | 13 | 4.9x | 18.6x |
| Payments infrastructure | 20 | 4.6x | 17.2x |
| Crypto infrastructure | 9 | 3.7x | Not meaningful |
| Merchant acquiring and processing | 14 | 2.8x | 11.9x |
| Insurtech | 12 | 2.3x | 13.1x |
| Lending platforms | 14 | 1.9x | 9.4x |
- B2B finance software commands the highest median multiple at 6.3x revenue, 3.3 times the 1.9x paid for lending platforms.
- Payments splits in two: payments infrastructure deals priced at 4.6x revenue, while merchant acquiring and processing deals priced at 2.8x.
- Segment sets the starting price in a sale. B2B finance software sells for a median 6.3x revenue, against 1.9x for lending platforms. Payments infrastructure was the most active segment, with 20 of 125 deals.
Fintech M&A Multiples, 2022 to 2026
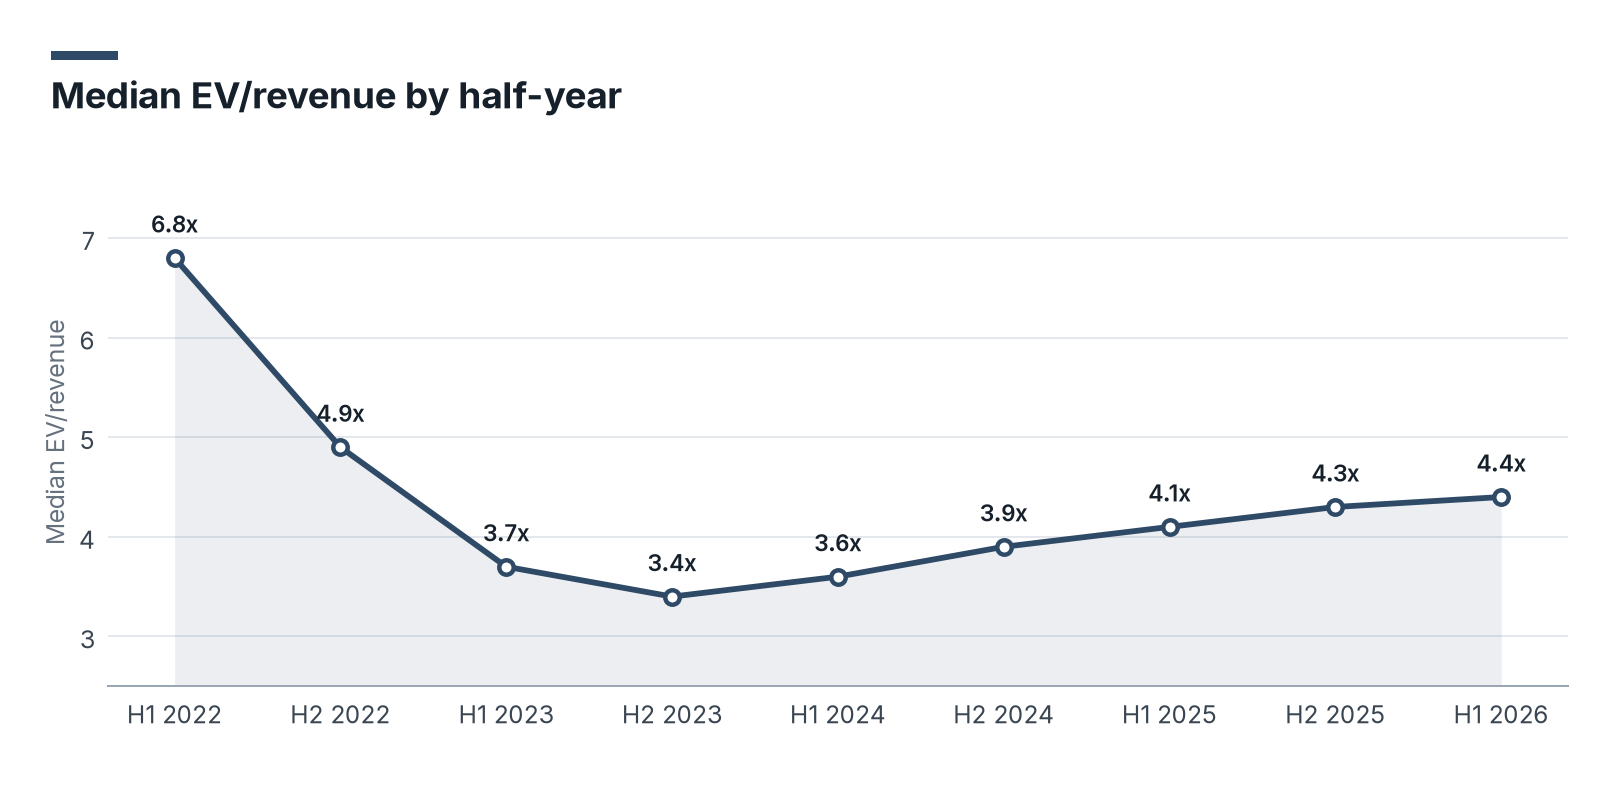
In the table below, we track the number of deals and the median EV/revenue multiple across all segments by half-year.
| Period | Deals Closed | Median EV/Revenue |
|---|---|---|
| H1 2022 | 98 | 6.8x |
| H2 2022 | 81 | 4.9x |
| H1 2023 | 63 | 3.7x |
| H2 2023 | 66 | 3.4x |
| H1 2024 | 69 | 3.6x |
| H2 2024 | 72 | 3.9x |
| H1 2025 | 64 | 4.1x |
| H2 2025 | 61 | 4.3x |
| H1 2026 | 64 | 4.4x |
- The median multiple fell 50%, from 6.8x in H1 2022 to 3.4x in H2 2023.
- It has risen in every half-year since, reaching 4.4x in H1 2026, 29% above the low.
- Prices are recovering faster than deal volume. The median multiple rose to 4.4x in H1 2026, 29% above the low, while deal count stayed 35% below H1 2022.
Multiples by Target Revenue Growth
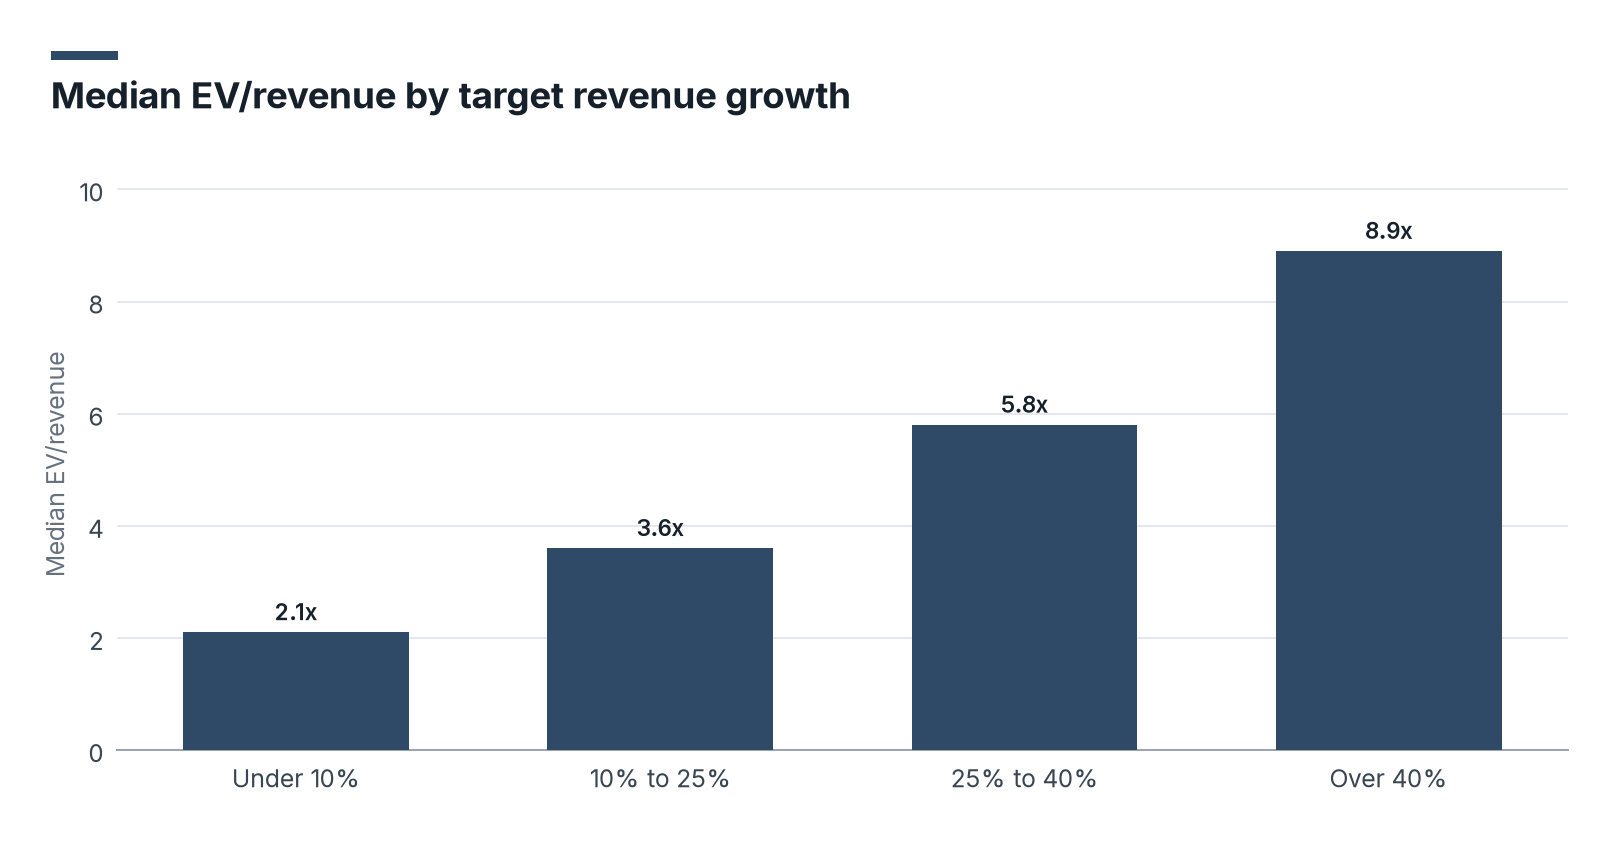
Growth is the strongest single predictor of price in our dataset. The table below groups deals by the target's year-over-year revenue growth at the time of the transaction.
| Target Revenue Growth | Share of Deals | Median EV/Revenue | Median EV/EBITDA |
|---|---|---|---|
| Under 10% | 31% | 2.1x | 10.2x |
| 10% to 25% | 37% | 3.6x | 15.8x |
| 25% to 40% | 21% | 5.8x | 22.4x |
| Over 40% | 11% | 8.9x | 31.0x |
| Target Revenue Growth | Median EV/Revenue |
|---|---|
| Under 10% | 2.1x |
| 10% to 25% | 3.6x |
| 25% to 40% | 5.8x |
| Over 40% | 8.9x |
- Targets growing faster than 40% a year sold for a median 8.9x revenue, 4.2 times the 2.1x paid for targets growing under 10%.
- The largest step between bands is at the top: moving from 25% to 40% growth into the over-40% band adds 3.1 turns of revenue.
- Growth is the clearest way to raise a sale price. Targets growing over 40% sold for 8.9x revenue, against 2.1x for those under 10%. Only 11% of deals fell in that top band.
Multiples by Buyer Type
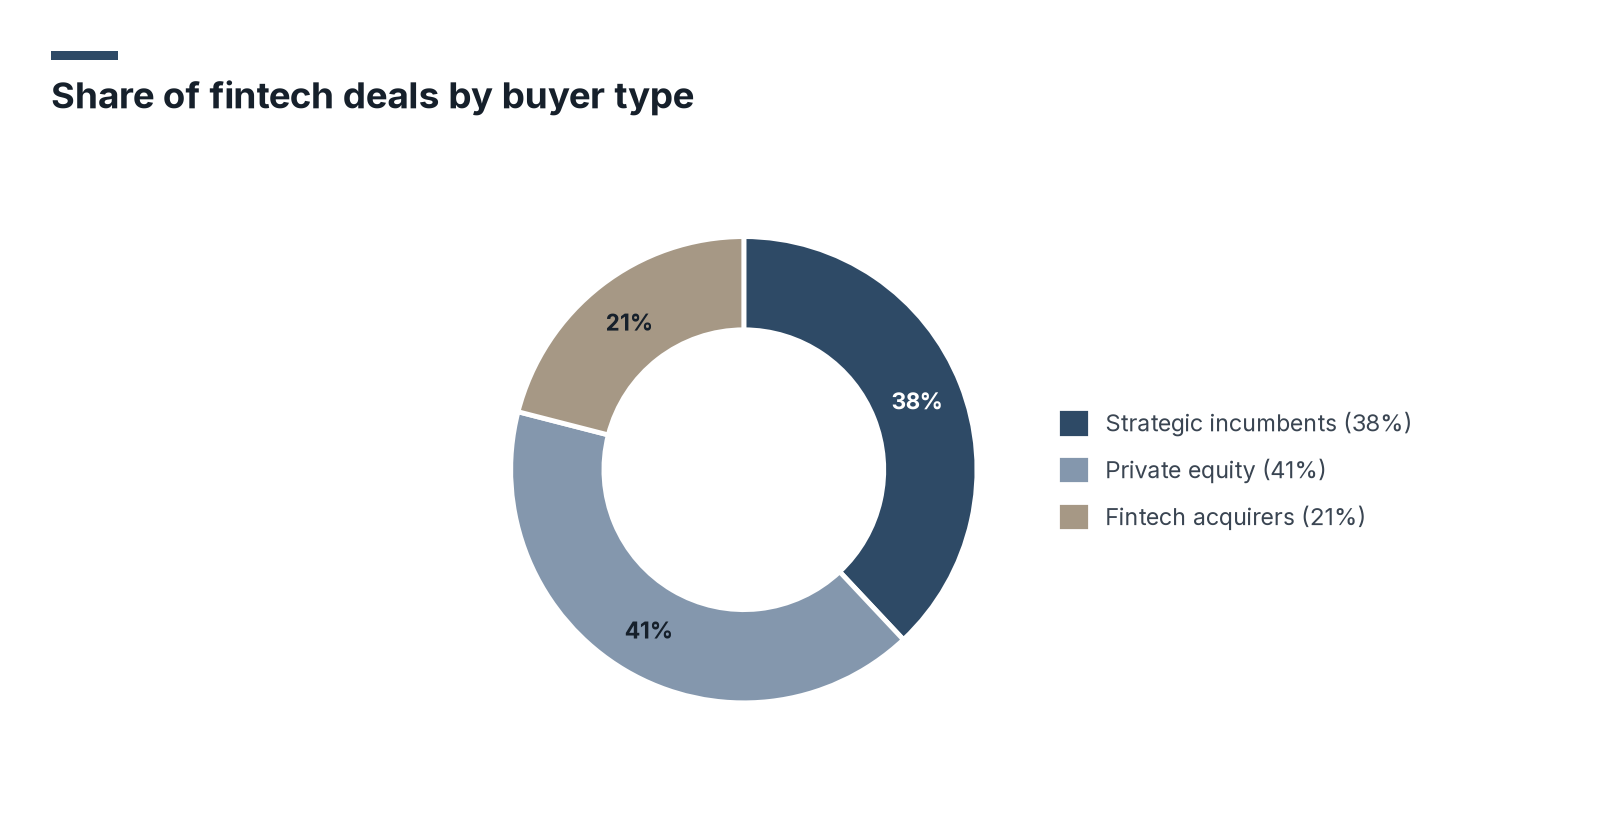
The table below compares strategic incumbents (banks, card networks and established processors), private equity firms, and venture-backed or public fintech companies acting as acquirers.
| Buyer Type | Share of Deals | Median EV/Revenue | Median Deal Size |
|---|---|---|---|
| Strategic incumbents | 38% | 4.7x | $142M |
| Private equity | 41% | 3.9x | $265M |
| Fintech acquirers | 21% | 4.2x | $58M |
- Private equity was the most frequent buyer, accounting for 41% of deals, and wrote the largest checks at a median $265 million.
- Strategic incumbents paid the highest median multiple, 4.7x revenue, 0.8 turns above private equity.
- The buyer type shapes both price and deal size. Strategic incumbents paid a median 4.7x, while private equity made 41% of deals at a median $265 million.
Multiples by Deal Size and Buyer Type
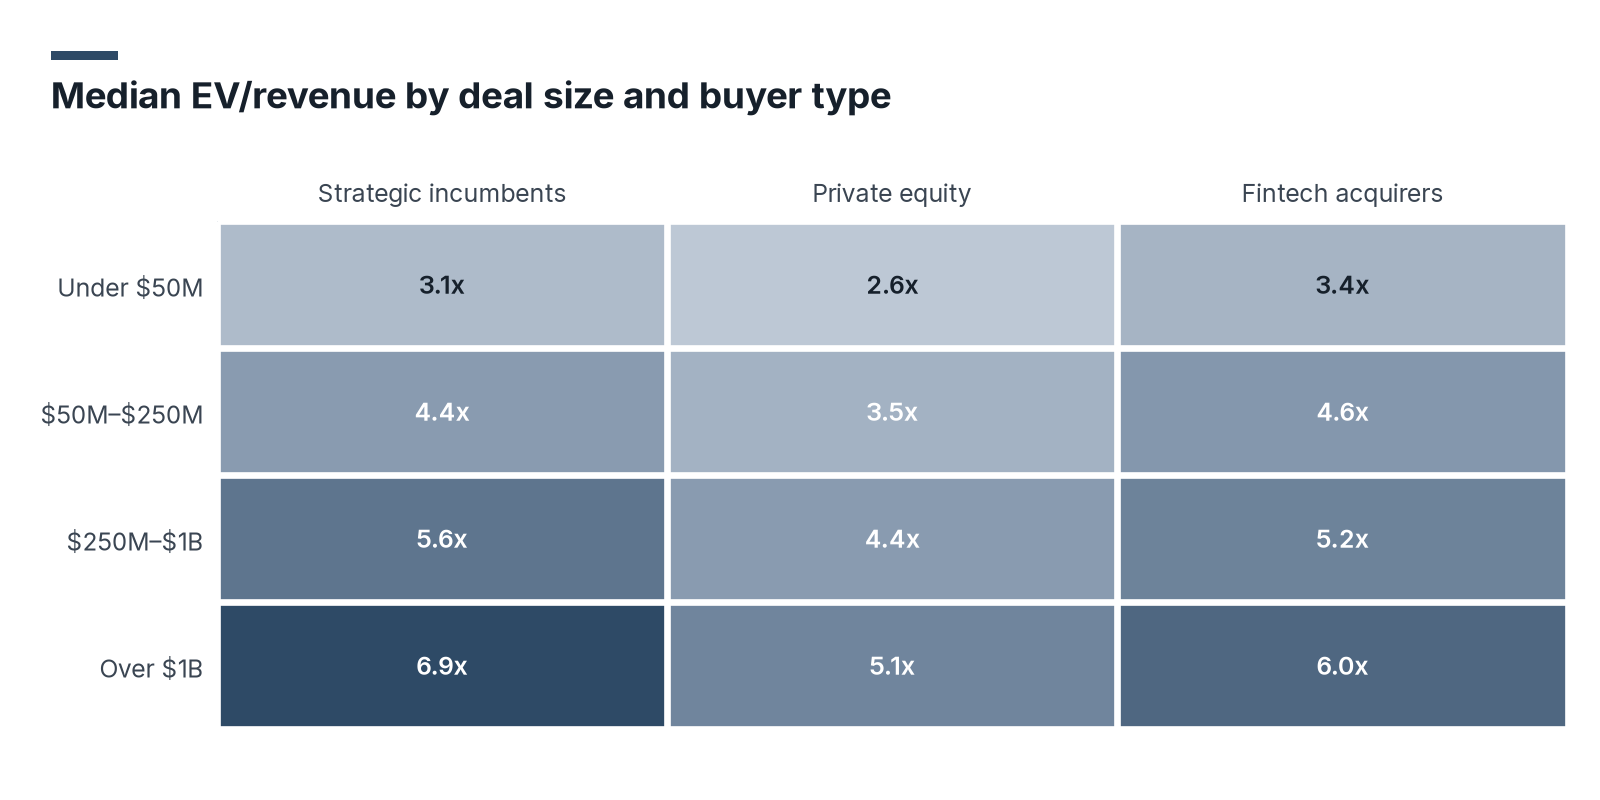
Larger fintech deals price at higher multiples. The table below shows the median EV/revenue multiple by deal size, and the heatmap below it splits each size band by buyer type.
| Deal Size (Enterprise Value) | Share of Deals | Median EV/Revenue |
|---|---|---|
| Under $50M | 34% | 2.9x |
| $50M-$250M | 39% | 4.1x |
| $250M-$1B | 19% | 5.0x |
| Over $1B | 8% | 6.1x |
| Deal Size | Strategic Incumbents | Private Equity | Fintech Acquirers |
|---|---|---|---|
| Under $50M | 3.1x | 2.6x | 3.4x |
| $50M-$250M | 4.4x | 3.5x | 4.6x |
| $250M-$1B | 5.6x | 4.4x | 5.2x |
| Over $1B | 6.9x | 5.1x | 6.0x |
- Deals above $1 billion priced at a median 6.1x revenue, more than twice the 2.9x for deals under $50 million.
- Strategic buyers paid the highest multiple of any buyer type in the two largest size bands, reaching 6.9x for deals above $1 billion.
- Large deals command much higher multiples. Deals above $1 billion priced at 6.1x, more than twice the 2.9x under $50 million.
What Raises and Lowers Fintech Multiples
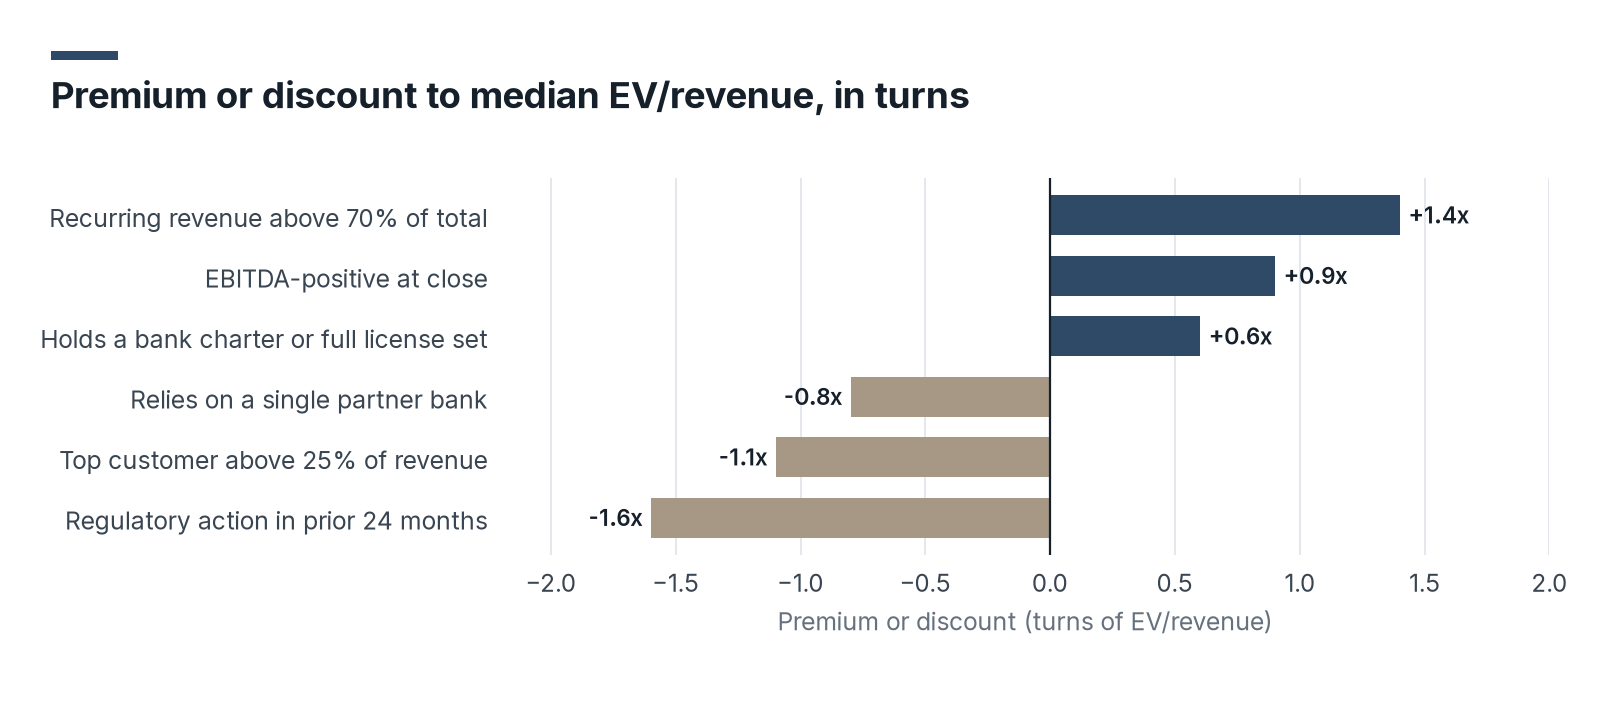
We compared deals with and without each of the characteristics below, holding segment and growth band constant. The table shows how often each characteristic appeared and the resulting premium or discount in turns of revenue.
| Deal Characteristic | Share of Deals | Median Premium or Discount (EV/Revenue) |
|---|---|---|
| Recurring revenue above 70% of total | 46% | +1.4x |
| EBITDA-positive at close | 39% | +0.9x |
| Holds a bank charter or full license set | 12% | +0.6x |
| Relies on a single partner bank | 27% | -0.8x |
| Top customer above 25% of revenue | 18% | -1.1x |
| Regulatory action in prior 24 months | 9% | -1.6x |
| Deal Characteristic | Premium or Discount |
|---|---|
| Recurring revenue above 70% of total | +1.4x |
| EBITDA-positive at close | +0.9x |
| Holds a bank charter or full license set | +0.6x |
| Relies on a single partner bank | -0.8x |
| Top customer above 25% of revenue | -1.1x |
| Regulatory action in prior 24 months | -1.6x |
- A recurring revenue share above 70% added a median 1.4 turns of revenue, the largest premium we measured.
- A regulatory action in the 24 months before the deal cut 1.6 turns, the largest discount, even though it appeared in only 9% of deals.
- Regulatory and partner bank risk cost sellers real money. A recent regulatory action cut 1.6 turns of revenue, and single partner bank dependence cut 0.8.
What Fintech M&A Valuation Trends Mean for 2027 and Beyond
When a fintech is sold, its price reflects how fast it grows, how much of its revenue repeats, and whether a regulator has recently acted against it. That matters beyond the buyer and the seller, because the sale price sets what founders, employees who hold stock and early investors take home.
Prices have climbed back since late 2023, but the number of deals has not, so buyers are paying more for fewer, stronger companies. If deal counts stay low, slower-growing fintechs have fewer buyers to sell to, and their owners may have to wait longer or accept a lower price.
So if you're preparing a fintech for sale, resolve any open regulatory matter before you go to market.
Sources
- Pulse of Fintech H1 2026. KPMG International, August 2026.
- A Closer Look at Public Fintech Health and Efficiency. Flagship Advisory Partners, October 2025.
- Full Year 2015 Finance Industry Trends. Berkery Noyes.
- Capital Markets Sector Leads Fintech M&A Activity. Finextra.