Fintech Fraud Loss Rate Benchmarks: 2026 Report
How much do fintech companies lose to fraud? We gathered loss data from U.S. fintech companies and compared it across their businesses and payment types.

Fintech companies lose money when criminals take over customer accounts, trick customers into sending payments or open accounts with made-up identities. How much they lose differs widely between lenders, payment companies and other fintechs, and between faster and slower ways of moving money, so we looked at how much each loses.
Our analysts studied net fraud losses, after recoveries, at 173 U.S. fintech companies, measured in basis points (bps), or hundredths of a percent, of the volume each company handles. Across all of them, the median net fraud loss rate is 9.1 bps.
The results below show how that rate varies by segment, fraud type, payment rail, and company age, and how fraud prevention spending relates to total fraud cost.
Fraud Loss Rates by Fintech Segment
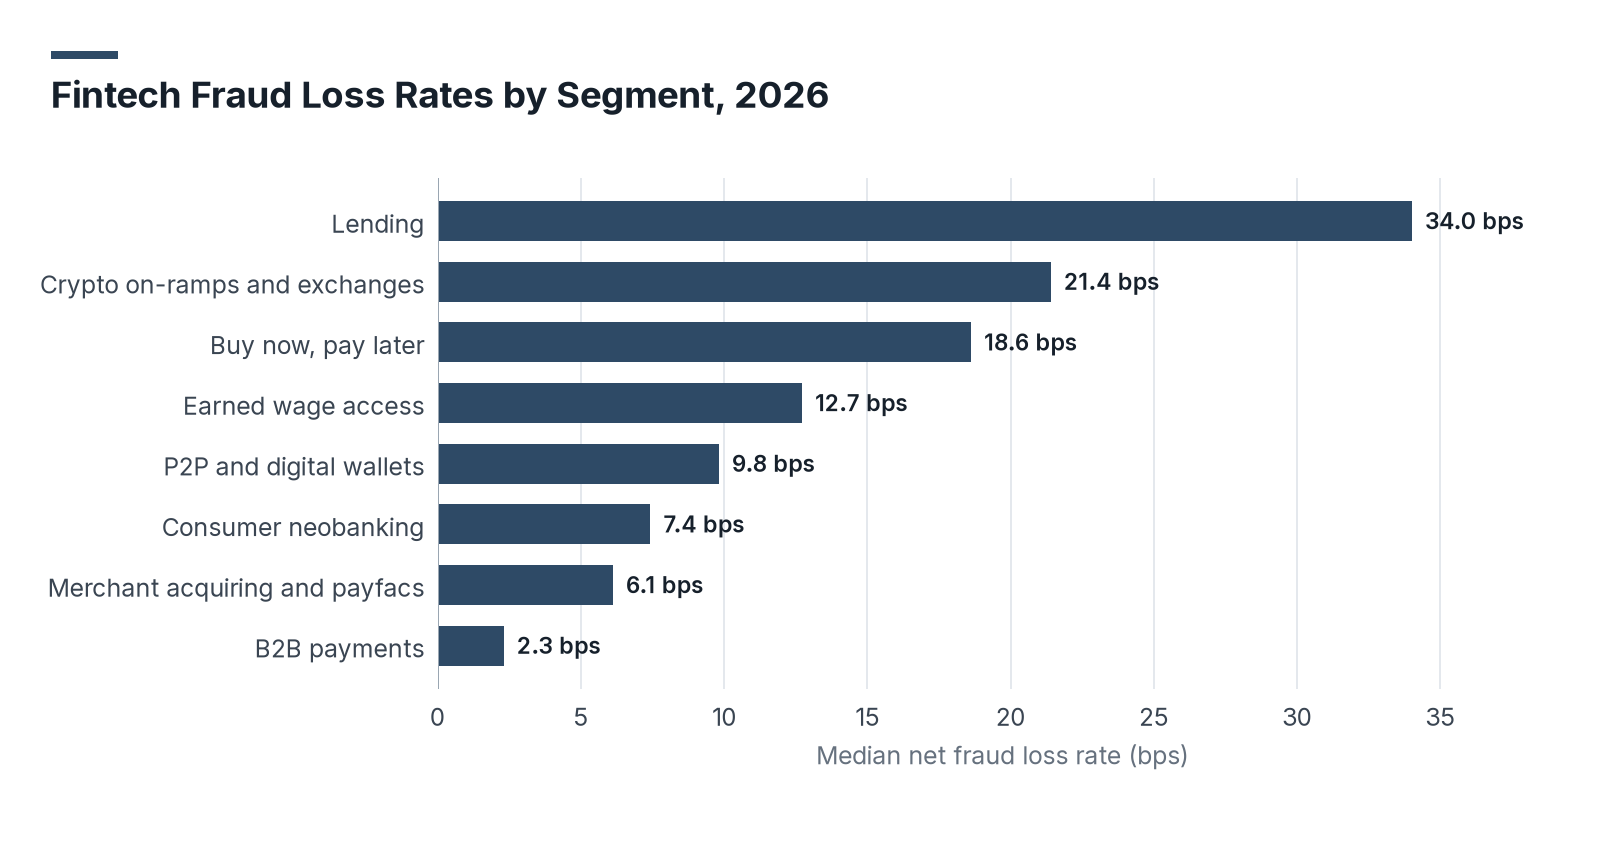
The table below shows the median gross fraud attempt rate (attempted fraud as a share of volume, whether or not it was stopped) and the median net fraud loss rate for each segment, measured against that segment's volume base.
| Segment | Companies | Volume Base | Median Gross Fraud Attempt Rate | Median Net Fraud Loss Rate |
|---|---|---|---|---|
| Lending | 21 | Originations | 112 bps | 34.0 bps |
| Crypto on-ramps and exchanges | 17 | Purchase volume | 64 bps | 21.4 bps |
| Buy now, pay later | 14 | Gross merchandise value | 51 bps | 18.6 bps |
| Earned wage access | 11 | Advances issued | 38 bps | 12.7 bps |
| P2P and digital wallets | 26 | Payment volume | 29 bps | 9.8 bps |
| Consumer neobanking | 31 | Debit and transfer volume | 24 bps | 7.4 bps |
| Merchant acquiring and payfacs | 29 | Processed volume | 26 bps | 6.1 bps |
| B2B payments | 24 | Payment volume | 8 bps | 2.3 bps |
- Lenders post the highest net loss rate at 34.0 bps of originations, driven by first-party and synthetic identity fraud that surfaces only when loans go unpaid.
- B2B payments has the lowest rate at 2.3 bps, about a quarter of the 9.1 bps median across all companies.
- Fraud losses depend heavily on the business model. Lenders lose 34.0 bps of originations, against 2.3 bps in B2B payments and a 9.1 bps median overall. BNPL providers' losses equal 36% of attempted fraud.
Fraud Losses by Fraud Type
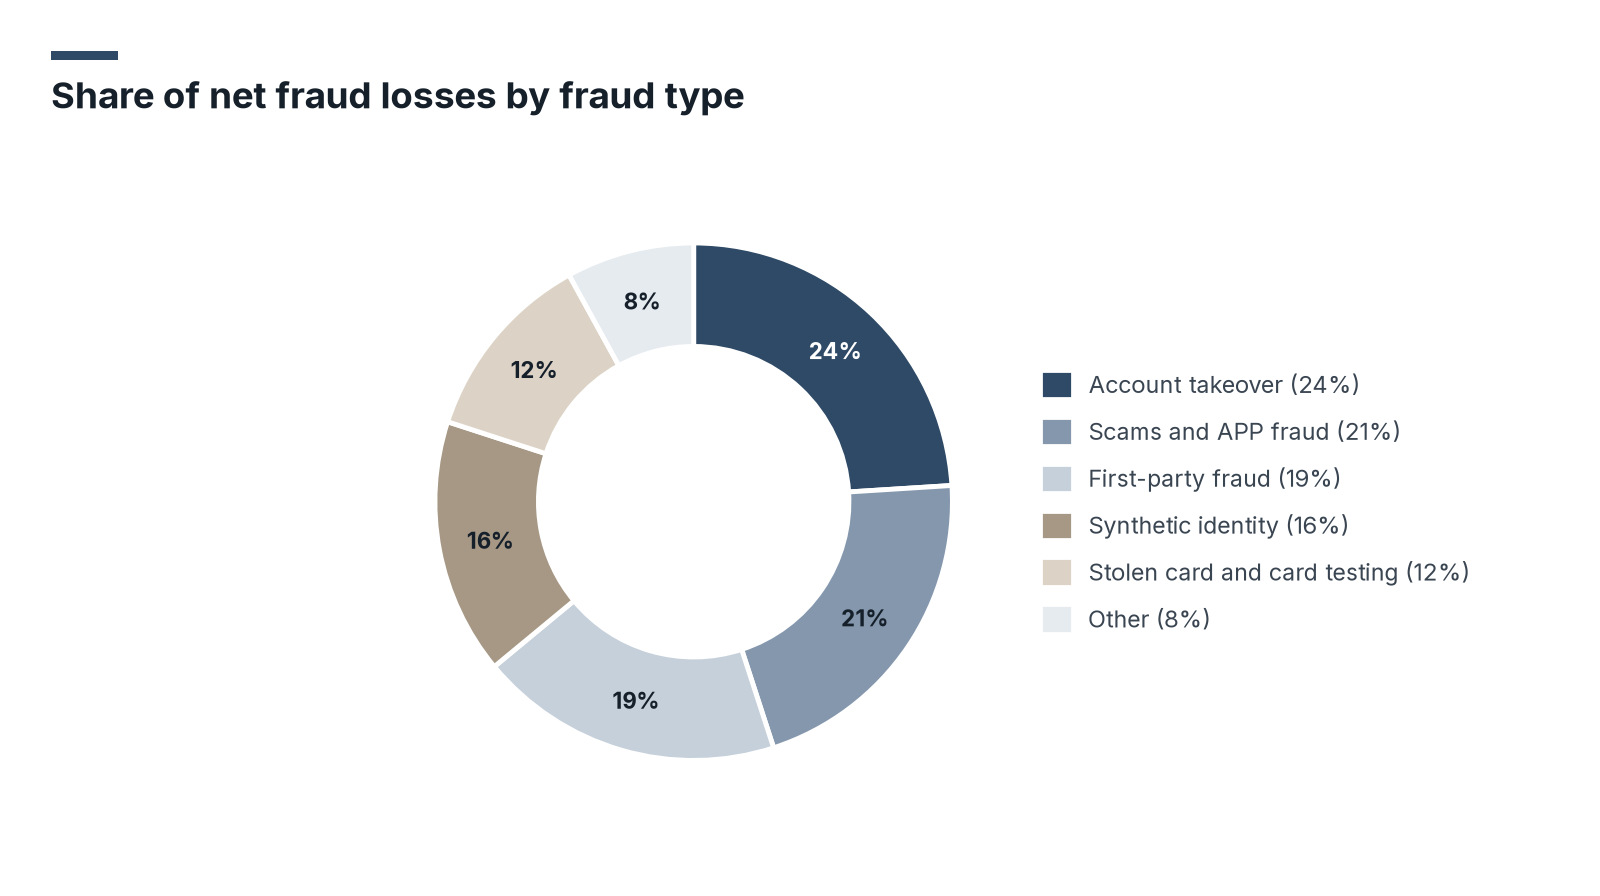
In the table below, we break net fraud losses across all companies into six fraud types, along with the median loss per confirmed incident.
| Fraud Type | Share of Net Fraud Losses | Median Loss per Incident |
|---|---|---|
| Account takeover | 24% | $1,240 |
| Scams and authorized push payment fraud | 21% | $2,860 |
| First-party fraud | 19% | $910 |
| Synthetic identity | 16% | $4,150 |
| Stolen card and card testing | 12% | $186 |
| Other | 8% | $520 |
- Account takeover is the largest source of losses at 24%, followed by scams and authorized push payment fraud at 21%.
- Synthetic identity fraud causes the costliest incidents, at a median $4,150 each, because synthetic accounts are often built up over months before they default.
- Account takeover and scams now cause the most losses, which puts customer accounts at the center of fraud risk. They account for 24% and 21% of net losses.
Fraud Loss Rates by Payment Rail
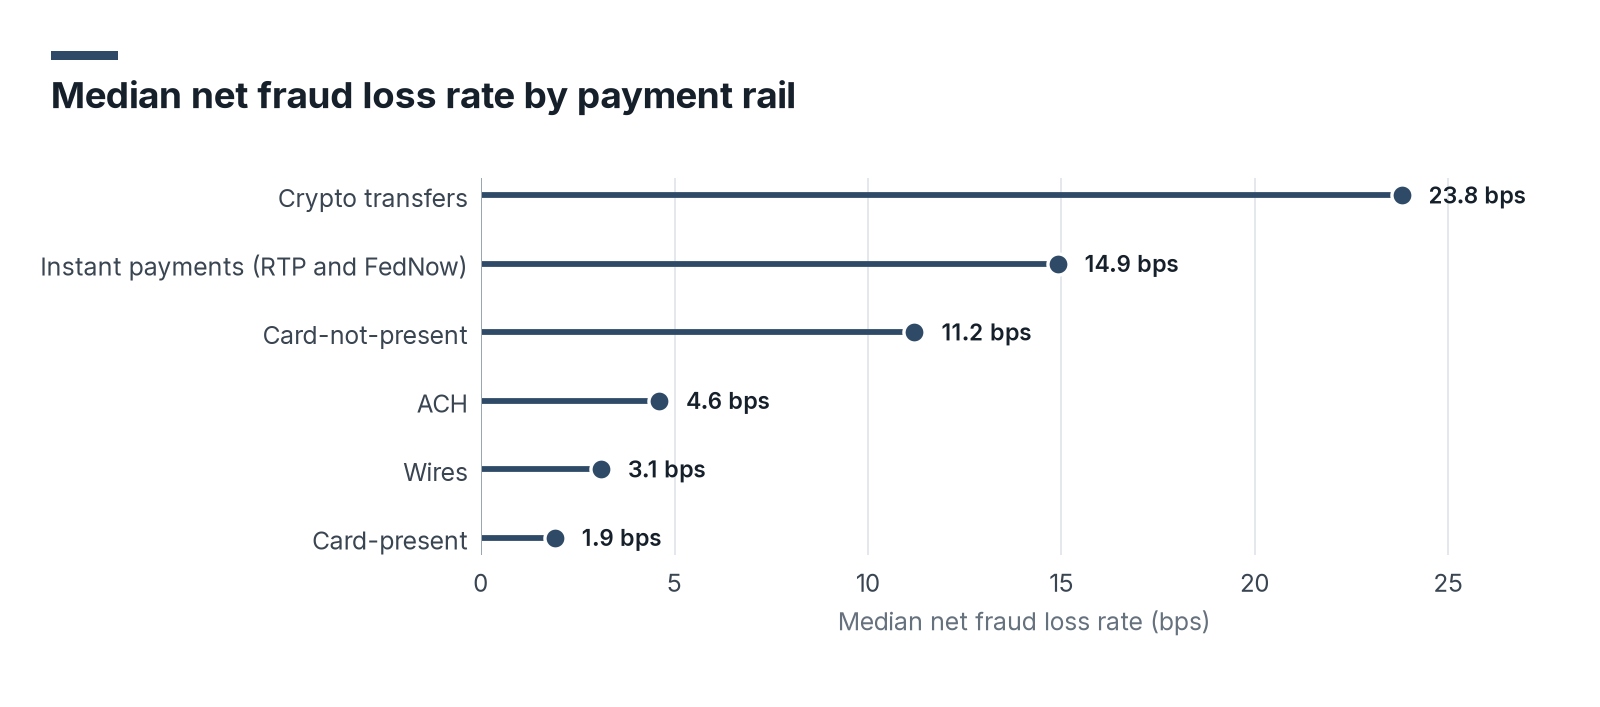
The table below compares median net fraud loss rates across payment rails, along with the median number of days between a fraudulent transaction and its detection.
| Payment Rail | Median Net Fraud Loss Rate | Median Days to Detection |
|---|---|---|
| Crypto transfers | 23.8 bps | 1.8 |
| Instant payments (RTP and FedNow) | 14.9 bps | 2.6 |
| Card-not-present | 11.2 bps | 34 |
| ACH | 4.6 bps | 9 |
| Wires | 3.1 bps | 4 |
| Card-present | 1.9 bps | 41 |
| Payment Rail | Median Net Fraud Loss Rate |
|---|---|
| Crypto transfers | 23.8 bps |
| Instant payments (RTP and FedNow) | 14.9 bps |
| Card-not-present | 11.2 bps |
| ACH | 4.6 bps |
| Wires | 3.1 bps |
| Card-present | 1.9 bps |
- Instant payments carry a 14.9 bps loss rate, 3.2 times the ACH rate, because funds settle before most fraud is caught and cannot be recalled.
- Card-present transactions have the lowest loss rate at 1.9 bps.
- Faster payments carry higher fraud risk for consumers and the firms that serve them. Instant payments lose 14.9 bps, 3.2 times the ACH rate, because funds cannot be recalled.
Fintech Fraud Loss Rates, 2021 to 2026
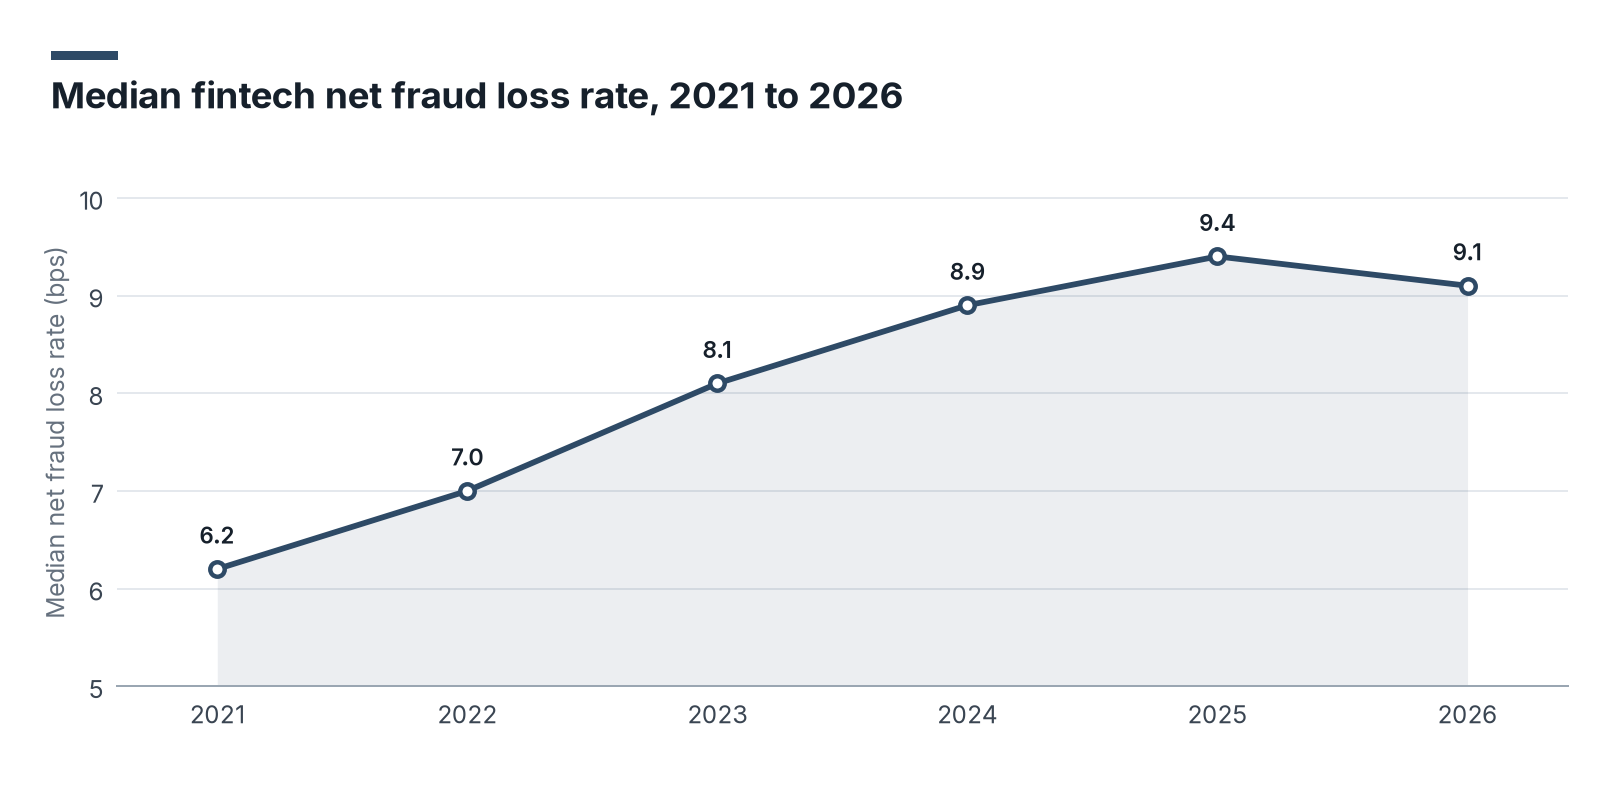
The table below tracks the median net fraud loss rate across our dataset by year, using companies with data for each year.
| Year | Median Net Fraud Loss Rate | Change vs. Prior Year |
|---|---|---|
| 2021 | 6.2 bps | Baseline |
| 2022 | 7.0 bps | +0.8 bps |
| 2023 | 8.1 bps | +1.1 bps |
| 2024 | 8.9 bps | +0.8 bps |
| 2025 | 9.4 bps | +0.5 bps |
| 2026 | 9.1 bps | -0.3 bps |
- The median net fraud loss rate rose 52% from 6.2 bps in 2021 to 9.4 bps in 2025.
- 2026 is the first year in the series in which the rate fell, to 9.1 bps, as more companies added device and behavioral signals to their account opening and login checks.
- The rise in fraud losses may be turning. The median rate rose 52% from 2021 to 2025, then fell to 9.1 bps in 2026 as companies added device and behavioral checks.
Fraud Loss Rates by Company Age
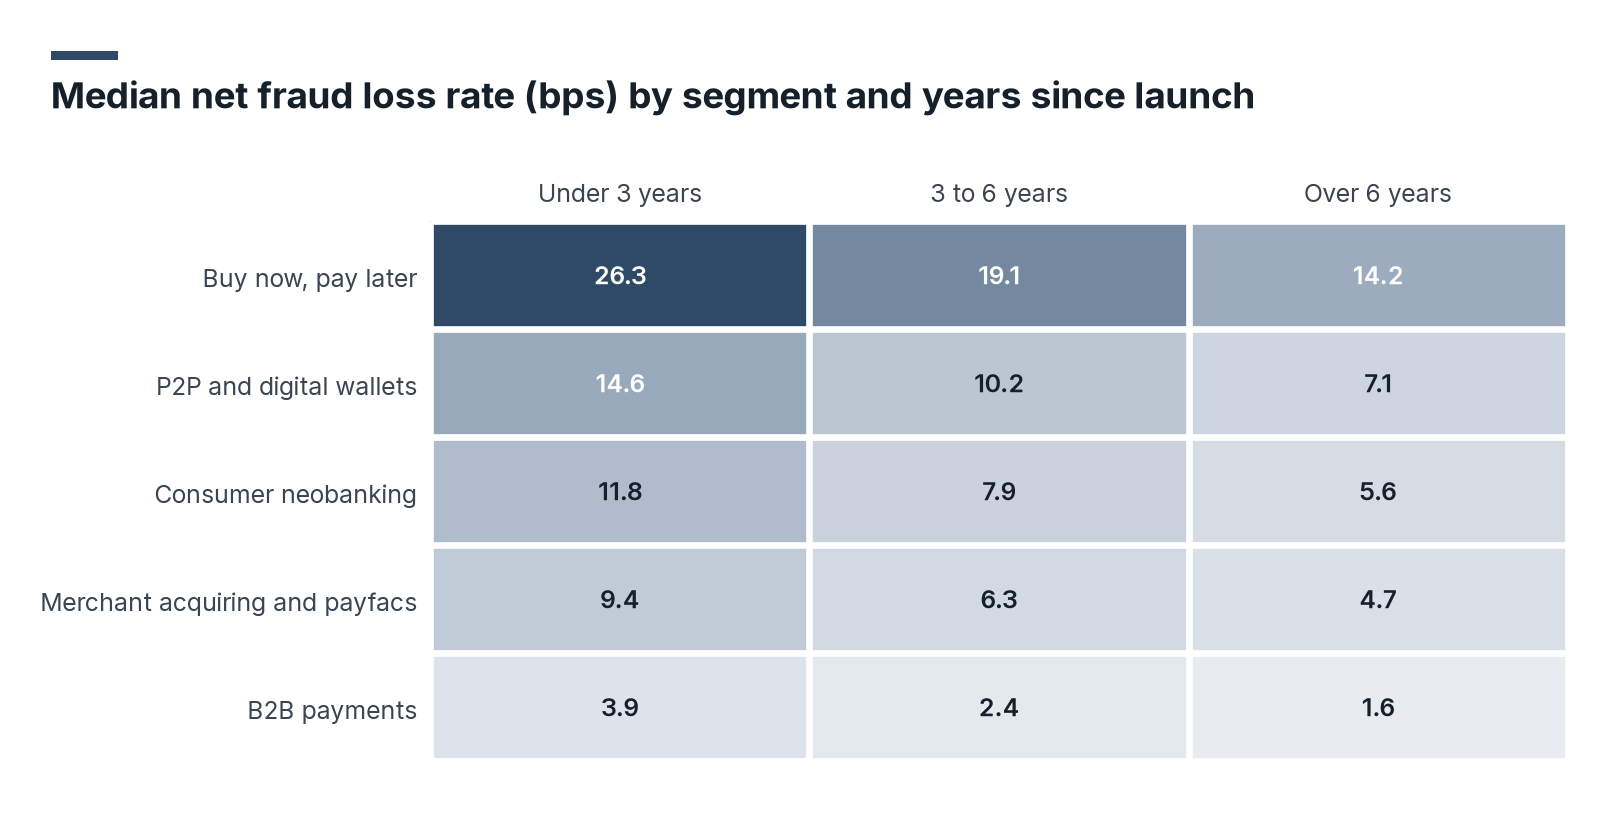
Younger fintechs lose more to fraud. The table below shows median net fraud loss rates by years since product launch, and the heatmap below it breaks those rates out for five segments.
| Years Since Launch | Companies | Median Net Fraud Loss Rate |
|---|---|---|
| Under 3 years | 46 | 13.2 bps |
| 3 to 6 years | 71 | 9.0 bps |
| Over 6 years | 56 | 6.4 bps |
| Segment | Under 3 years | 3 to 6 years | Over 6 years |
|---|---|---|---|
| Buy now, pay later | 26.3 | 19.1 | 14.2 |
| P2P and digital wallets | 14.6 | 10.2 | 7.1 |
| Consumer neobanking | 11.8 | 7.9 | 5.6 |
| Merchant acquiring and payfacs | 9.4 | 6.3 | 4.7 |
| B2B payments | 3.9 | 2.4 | 1.6 |
- Companies less than three years past launch lose a median 13.2 bps, roughly twice the 6.4 bps rate at companies more than six years past launch.
- The pattern holds in every segment we studied, which points to maturing fraud controls and better data rather than a change in business mix.
- New fintechs lose about twice as much to fraud as established ones. Companies under three years old lose 13.2 bps, against 6.4 bps for those over six years. Young BNPL providers lose the most, at 26.3 bps.
Fraud Prevention Spending and Total Fraud Cost
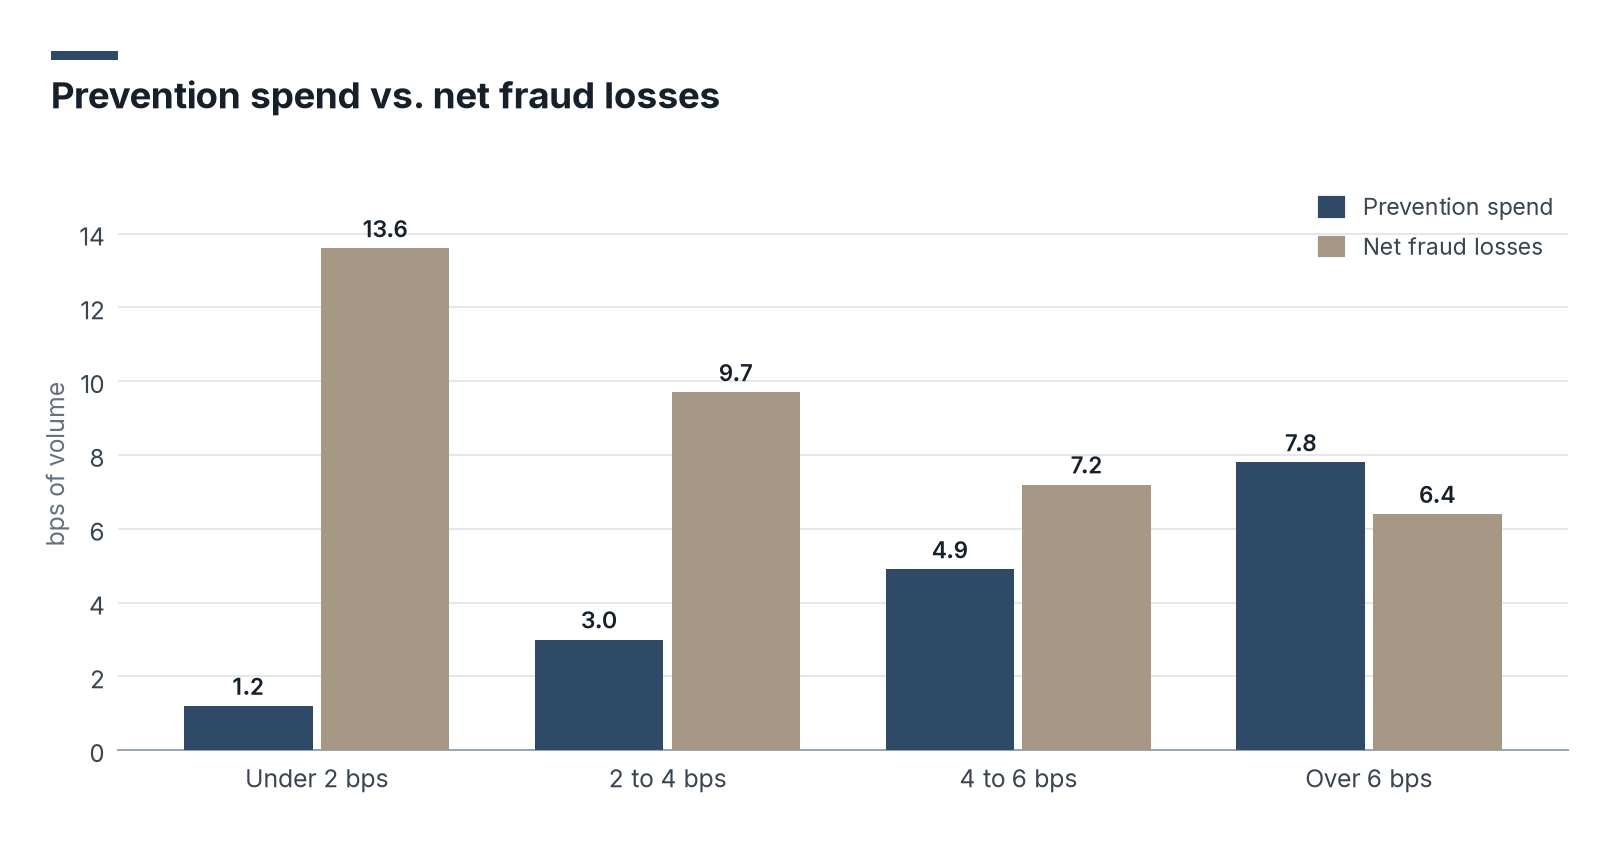
In the table below, we group companies by annual fraud prevention spending (tools, data and fraud operations staff) as a share of volume, and add that spending to net losses to show the total cost of fraud.
| Fraud Prevention Spend Band | Share of Companies | Median Prevention Spend | Median Net Fraud Loss Rate | Total Fraud Cost |
|---|---|---|---|---|
| Under 2 bps | 28% | 1.2 bps | 13.6 bps | 14.8 bps |
| 2 to 4 bps | 37% | 3.0 bps | 9.7 bps | 12.7 bps |
| 4 to 6 bps | 23% | 4.9 bps | 7.2 bps | 12.1 bps |
| Over 6 bps | 12% | 7.8 bps | 6.4 bps | 14.2 bps |
| Spend Band | Prevention Spend | Net Fraud Losses |
|---|---|---|
| Under 2 bps | 1.2 bps | 13.6 bps |
| 2 to 4 bps | 3.0 bps | 9.7 bps |
| 4 to 6 bps | 4.9 bps | 7.2 bps |
| Over 6 bps | 7.8 bps | 6.4 bps |
- Total fraud cost is lowest for companies spending 4 to 6 bps on prevention, at 12.1 bps, compared with 14.8 bps for companies spending under 2 bps.
- Above 6 bps, net losses fall only 0.8 bps while spending rises 2.9 bps, so total cost climbs back to 14.2 bps.
- Spending more on fraud prevention pays off only up to a point. Total fraud cost is lowest, at 12.1 bps, for companies spending 4 to 6 bps on prevention. Even so, 28% of companies spend under 2 bps.
What Fintech Fraud Loss Rate Trends Mean for 2027 and Beyond
For people who use fintech apps, the biggest fraud risk now comes through their own accounts: someone takes over a login, or a scammer talks a person into sending money. Faster payments raise the stakes, because money sent instantly arrives before anyone can stop it and usually cannot be pulled back.
Losses fell in 2026 for the first time in this study, after companies added device and behavior checks when people sign up and log in. Whether that holds comes down to the scams those checks cannot catch, where customers send the money themselves, and to how quickly instant payments replace slower transfers that can still be reversed.
So if someone asks you to pay by instant transfer, confirm who they are through a separate channel before you send the money.
Sources
- FTC Testimony, Joint Economic Committee Hearing on the Rising Scam Economy. Federal Trade Commission, March 2026.
- A Note from the Editors for This Special Fraud Issue. Consumer Compliance Outlook, Federal Reserve System, August 2025.
- The State of Fincrime in the US 2022. Featurespace, 2022.
- What Is Fraud Rate (bps)?. Sardine.
- More Than Two-Thirds of Financial Institutions Lost Over $500K to Fraud in 2022, Alloy Report Finds. Alloy.