Emergency Savings Statistics: 2026 Report

Our analysts reviewed the Federal Reserve's Report on the Economic Well-Being of U.S. Households in 2025, published in May 2026, and Bankrate's 2026 Emergency Savings Report, based on a December 2025 poll, as of Q4 2026. We charted how many adults hold three months of savings, how that share differs by age and education, and how many could cover a $400 emergency with cash.
Three months of savings is the benchmark the Federal Reserve tracks, and the $400 test shows whether a household can absorb a small shock.
Key Findings
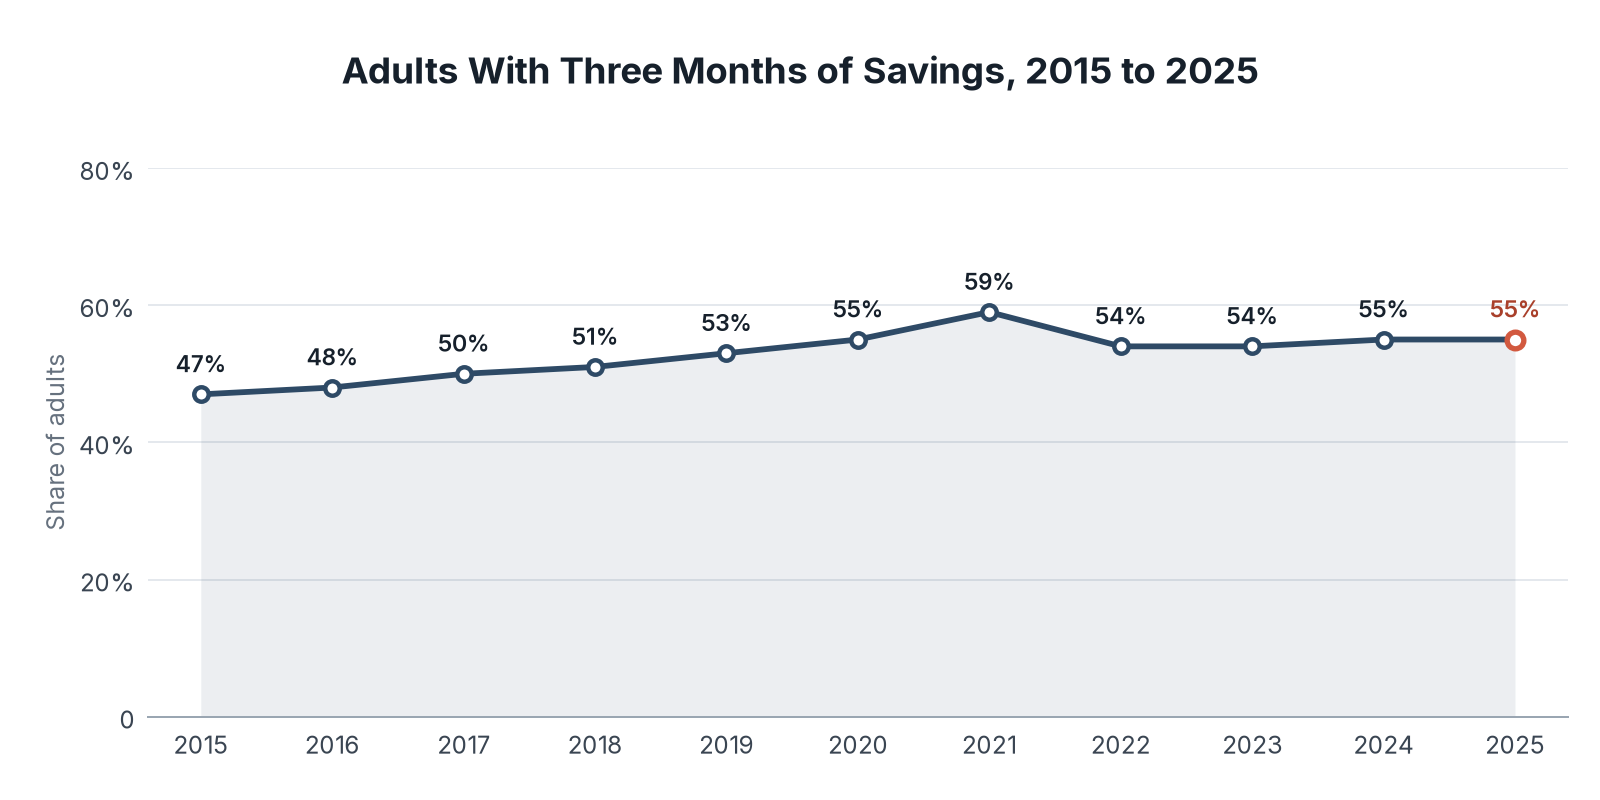
- 55% of US adults had savings to cover three months of expenses in 2025, unchanged from 2024 and below the 2021 peak of 59%.
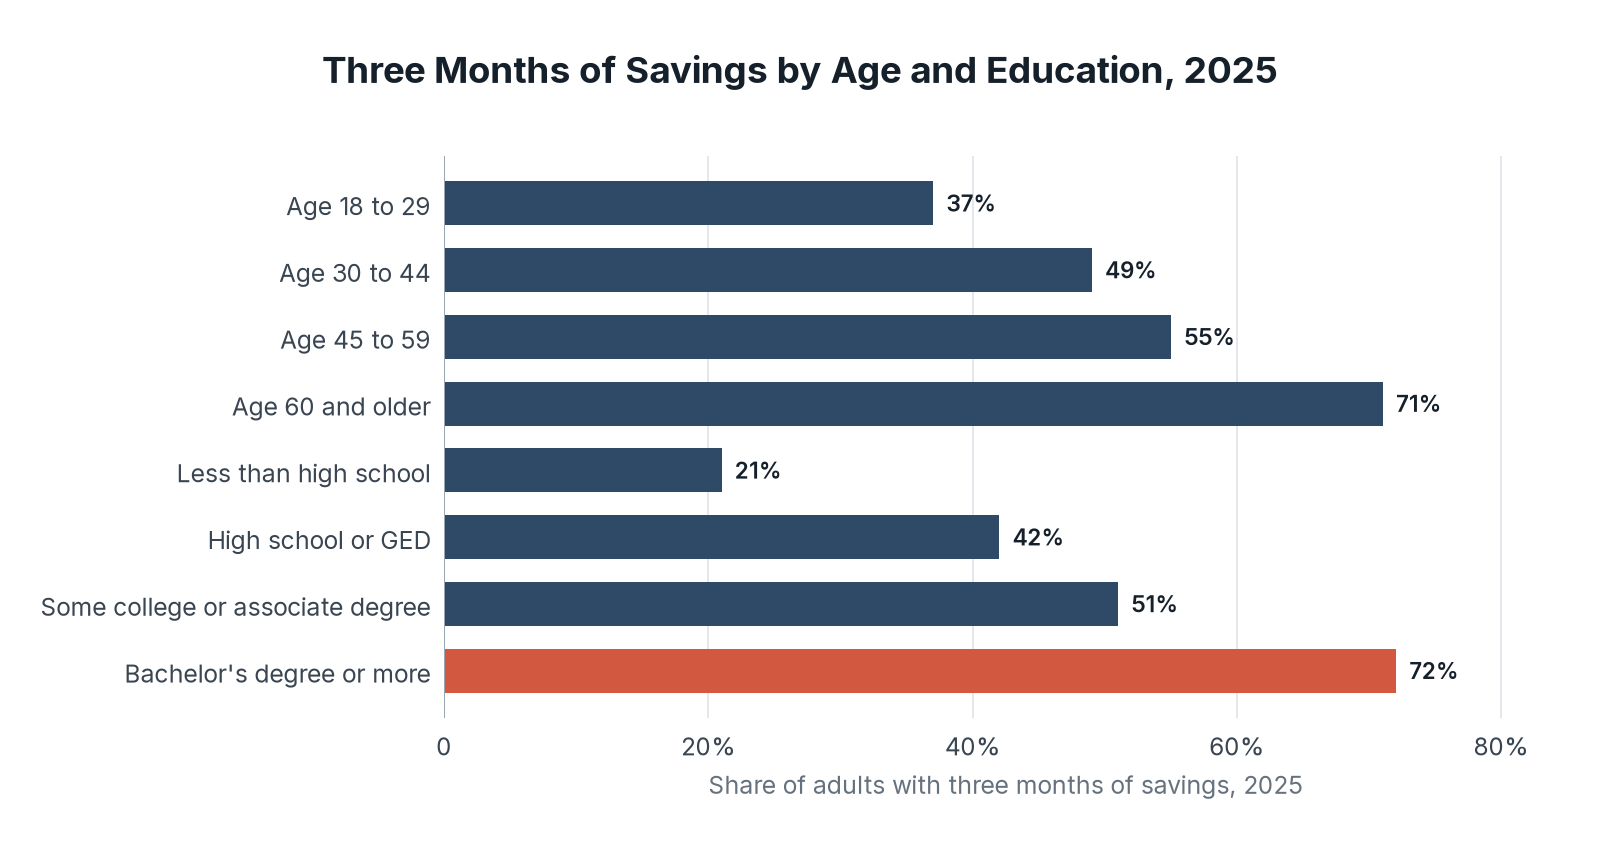
- 71% of adults aged 60 and older had three months of savings, compared with 37% of adults aged 18 to 29.
- 72% of adults with a bachelor's degree or more had three months of savings, compared with 21% of adults without a high school degree.
- Bankrate found that 47% of Americans had enough savings or access to funds to cover a $1,000 emergency expense.
The Share of Adults With Three Months of Savings Has Held at 55% for Two Years
The share of adults with three months of savings rose from 47% in 2015 to 59% in 2021, then fell to 54% in 2022 and 2023. It was 55% in 2024 and 2025.
| Year | Share of adults |
|---|---|
| 2015 | 47% |
| 2016 | 48% |
| 2017 | 50% |
| 2018 | 51% |
| 2019 | 53% |
| 2020 | 55% |
| 2021 | 59% |
| 2022 | 54% |
| 2023 | 54% |
| 2024 | 55% |
| 2025 | 55% |
Adults Aged 60 and Older Are Nearly Twice as Likely as Adults Under 30 to Have Three Months of Savings
The share rises at every step in age, from 37% for adults aged 18 to 29 to 71% for adults aged 60 and older. Education shows a wider spread: 72% of adults with a bachelor's degree or more had three months of savings, three times the 21% for adults without a high school degree.
| Group | Share of adults |
|---|---|
| Age 18 to 29 | 37% |
| Age 30 to 44 | 49% |
| Age 45 to 59 | 55% |
| Age 60 and older | 71% |
| Less than high school | 21% |
| High school or GED | 42% |
| Some college or associate degree | 51% |
| Bachelor's degree or more | 72% |
Savings also followed what was left at the end of the month. Among adults who never had money left over, 13% had three months of savings, compared with 52% of those who sometimes did and 86% of those who always did.
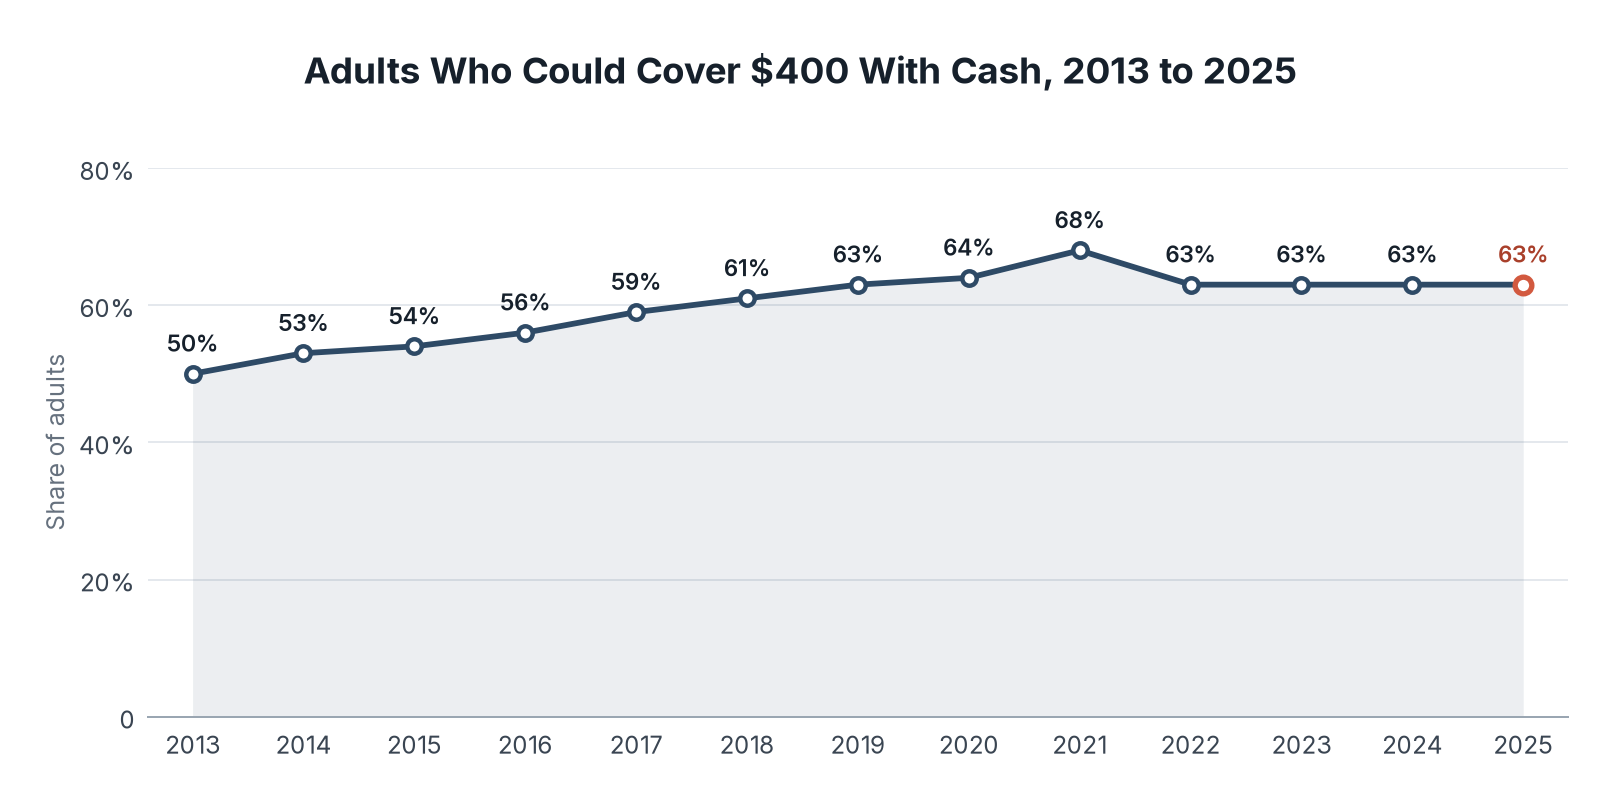
63% of Adults Could Cover a $400 Emergency With Cash, Down From 68% in 2021
The share of adults who could pay a $400 emergency expense completely with cash or its equivalent climbed from 50% in 2013 to 68% in 2021. It has been 63% in each year since 2022.
| Year | Share of adults |
|---|---|
| 2013 | 50% |
| 2014 | 53% |
| 2015 | 54% |
| 2016 | 56% |
| 2017 | 59% |
| 2018 | 61% |
| 2019 | 63% |
| 2020 | 64% |
| 2021 | 68% |
| 2022 | 63% |
| 2023 | 63% |
| 2024 | 63% |
| 2025 | 63% |
Differences by Race and Ethnicity
In 2025, 68% of Asian adults, 61% of White adults, 43% of Hispanic adults, and 38% of Black adults had three months of savings. Metro residents (56%) were more likely than non-metro residents (49%) to have it, and parents living with children under 18 (47%) were less likely than other adults (57%).
Bankrate: Savings Compared With Credit Card Debt
Bankrate's December 2025 poll found that 29% of Americans had more credit card debt than emergency savings, while 44% had more savings than card debt and 19% had neither. Asked about priorities, 31% said building savings and paying down card debt were equally important, 29% put savings first, and 21% put debt first.
Compared with a year earlier, 58% of adults said they had less or the same emergency savings, 21% had more, and 17% had none then and none now.
What the Numbers Mean for a Saver
About half of adults hold three months of savings, so the benchmark is not typical. Age and education account for much of the gap, and a larger buffer is more common among households that regularly have money left at the end of the month.
A smaller target still helps: the $400 test is met by 63% of adults, and a first goal of $1,000 puts a household among the 47% Bankrate found could cover that amount.
Data Collection and Methodology
We reviewed sources available in Q4 2026. Federal Reserve figures come from its Survey of Household Economics and Decisionmaking, published in May 2026 as the Report on the Economic Well-Being of U.S. Households in 2025, and cover all adults unless noted. Bankrate figures come from its Emergency Savings Report, an opinion survey conducted with SSRS and YouGov and polled in December 2025. The two surveys ask different questions, so their figures are best read within each source.
Sources
- Fintech Index, Emergency Savings Study: analysis of Federal Reserve and Bankrate emergency savings data, conducted November 2026.
- Federal Reserve, Economic Well-Being of U.S. Households in 2025
- Federal Reserve, Emergency Savings Table
- Bankrate, 2026 Emergency Savings Report
- Table 1: Source: Federal Reserve, Economic Well-Being of U.S. Households in 2025. Data: fed_three_month_emergency_savings_by_year.csv
- Chart 1: Source: Federal Reserve, Economic Well-Being of U.S. Households in 2025.
- Table 2: Source: Federal Reserve, Economic Well-Being of U.S. Households in 2025. Data: fed_three_month_emergency_savings_by_age_and_education_2025.csv
- Chart 2: Source: Federal Reserve, Economic Well-Being of U.S. Households in 2025.
- Table 3: Source: Federal Reserve, Economic Well-Being of U.S. Households in 2025. Data: fed_400_dollar_emergency_cash_by_year.csv
- Chart 3: Source: Federal Reserve, Economic Well-Being of U.S. Households in 2025.