Contactless Payment Statistics: 2026 Report

Our analysts reviewed Visa's annual reports for fiscal 2020 through fiscal 2026, Mastercard's quarterly results, the Bank of Canada's 2025 Methods-of-Payment Survey, UK Finance's payment figures for 2025, and the Reserve Bank of Australia's 2025 consumer payments survey, as of Q4 2026. We charted how fast tap to pay grew in the US, how the contactless share compares across card networks and countries, and how much it rose in the latest year.
A contactless payment is a card payment made by tapping a physical card, phone, or watch on a terminal, with no need to insert or swipe the card.
Key Findings
- 76% of face-to-face Visa transactions in the US were contactless in September 2026, up from 28% in fiscal 2022.
- Worldwide, 84% of face-to-face Visa transactions and 80% of in-person Mastercard purchases were contactless in 2026.
- 63% of all in-person payments in Canada were contactless in 2025, up from 60% in 2023.
- UK consumers made 19.2 billion contactless payments in 2025, 39% of all UK payments, up from 3% a decade earlier.
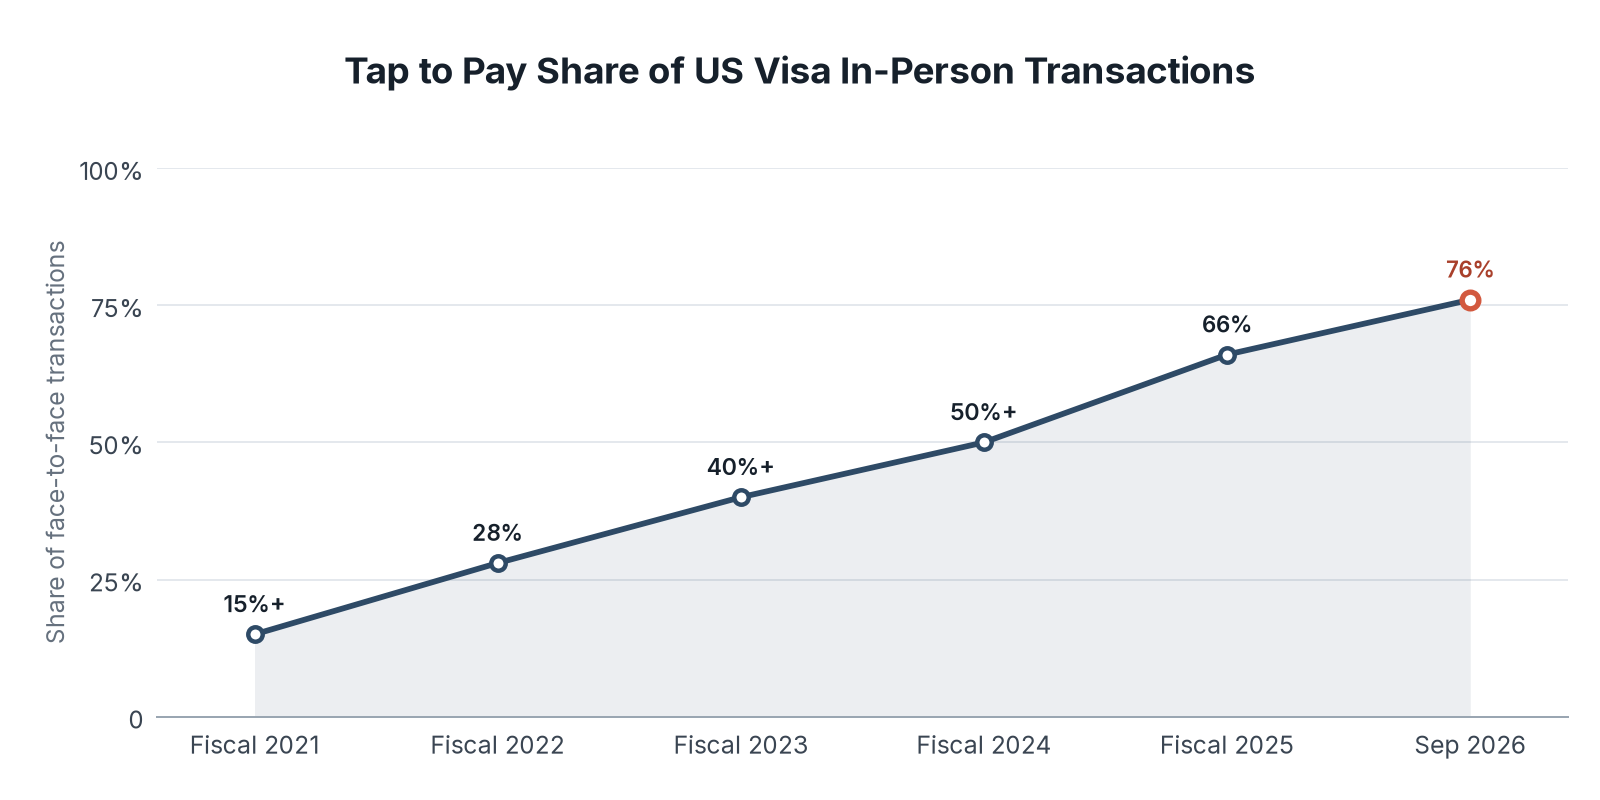
US Tap to Pay Grew From 15% to 76% of Visa In-Person Transactions in Five Years
The US was a late adopter of contactless cards. In fiscal 2021, tap to pay covered just over 15% of face-to-face Visa transactions in the US, while outside the US the share was close to 70%. By September 2026 the US share was 76%, eight points short of Visa's worldwide share.
| Period | Visa in the US | Visa worldwide |
|---|---|---|
| Fiscal 2020 | n/a | 43% |
| Fiscal 2021 | More than 15% | n/a |
| Fiscal 2022 | 28% | n/a |
| Fiscal 2023 | More than 40% | n/a |
| Fiscal 2024 | More than 50% | n/a |
| Fiscal 2025 | 66% | 79% |
| September 2026 | 76% | 84% |
Key Findings
- The US share rose by 10 percentage points between fiscal 2025 and September 2026.
- Visa's count of Tap to Pay enabled cards in the US grew from 400 million in fiscal 2021 to more than 535 million in fiscal 2024.
- Visa processed more than 2.9 billion contactless transit transactions in fiscal 2026, and its Tap to Phone service, which lets sellers take tap payments on a phone, passed 25 million transacting devices.
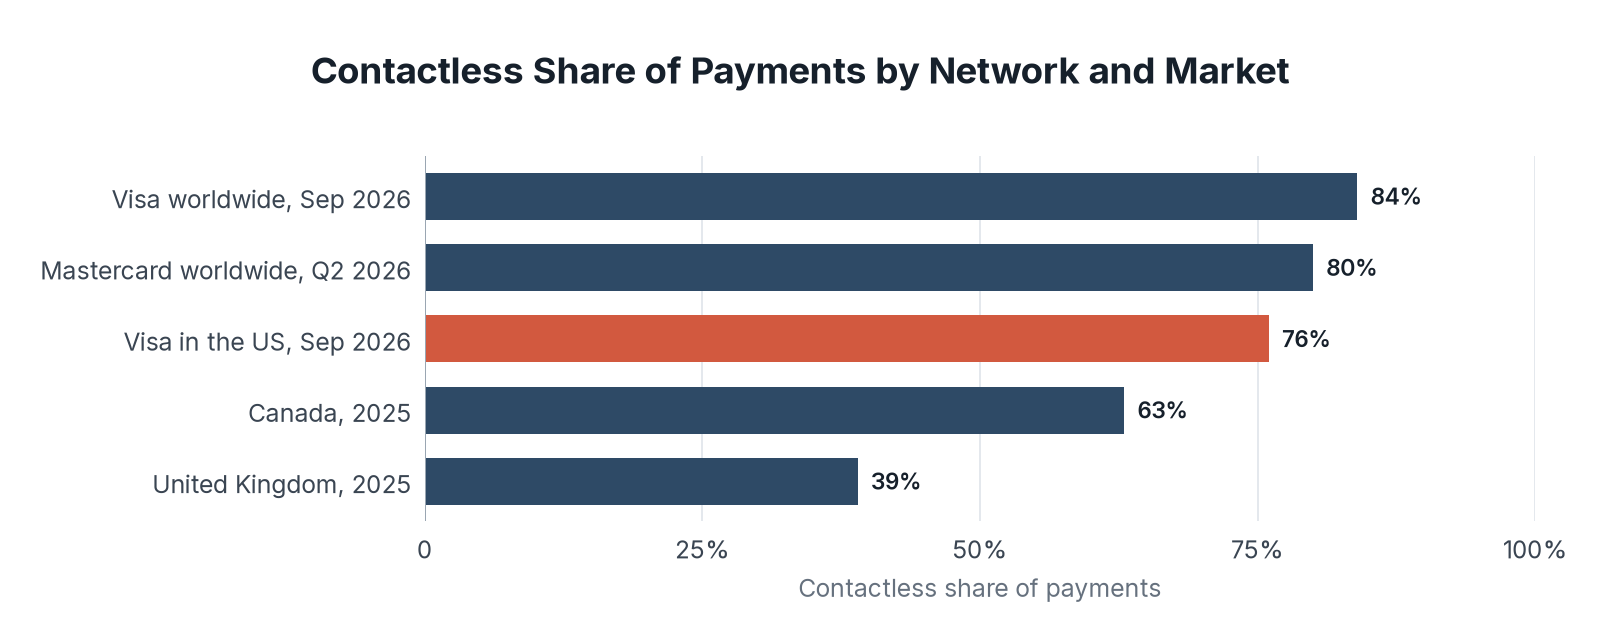
Contactless Covers 84% of Visa Payments Worldwide but 39% of UK Payments
The share depends on what is counted. Card network figures cover only in-person card payments, while the Canadian and UK figures include cash, and the UK figure also includes online payments and direct debits.
| Network or market | Contactless share | Measure | Period |
|---|---|---|---|
| Visa worldwide | 84% | Face-to-face Visa transactions | September 2026 |
| Mastercard worldwide | 80% | In-person switched purchase transactions | Q2 2026 |
| Visa in the US | 76% | Face-to-face Visa transactions | September 2026 |
| Canada | 63% | All in-person payments | 2025 |
| United Kingdom | 39% | All payments | 2025 |
Key Findings
- In Canada, contactless payments made up 61% of the value of in-person purchases in 2025, and phones and other mobile devices accounted for one quarter of contactless credit card payments.
- In Australia, payments made by tapping a phone or other device accounted for around 40% of card payments in 2025, up from 31% in 2022, while inserted cards made up around 5%.
- More than 72% of US consumers paid with a mobile phone at least once in the 12 months to October 2025, and 14% of US in-person payments were made with a mobile device, up from 11% in 2024.
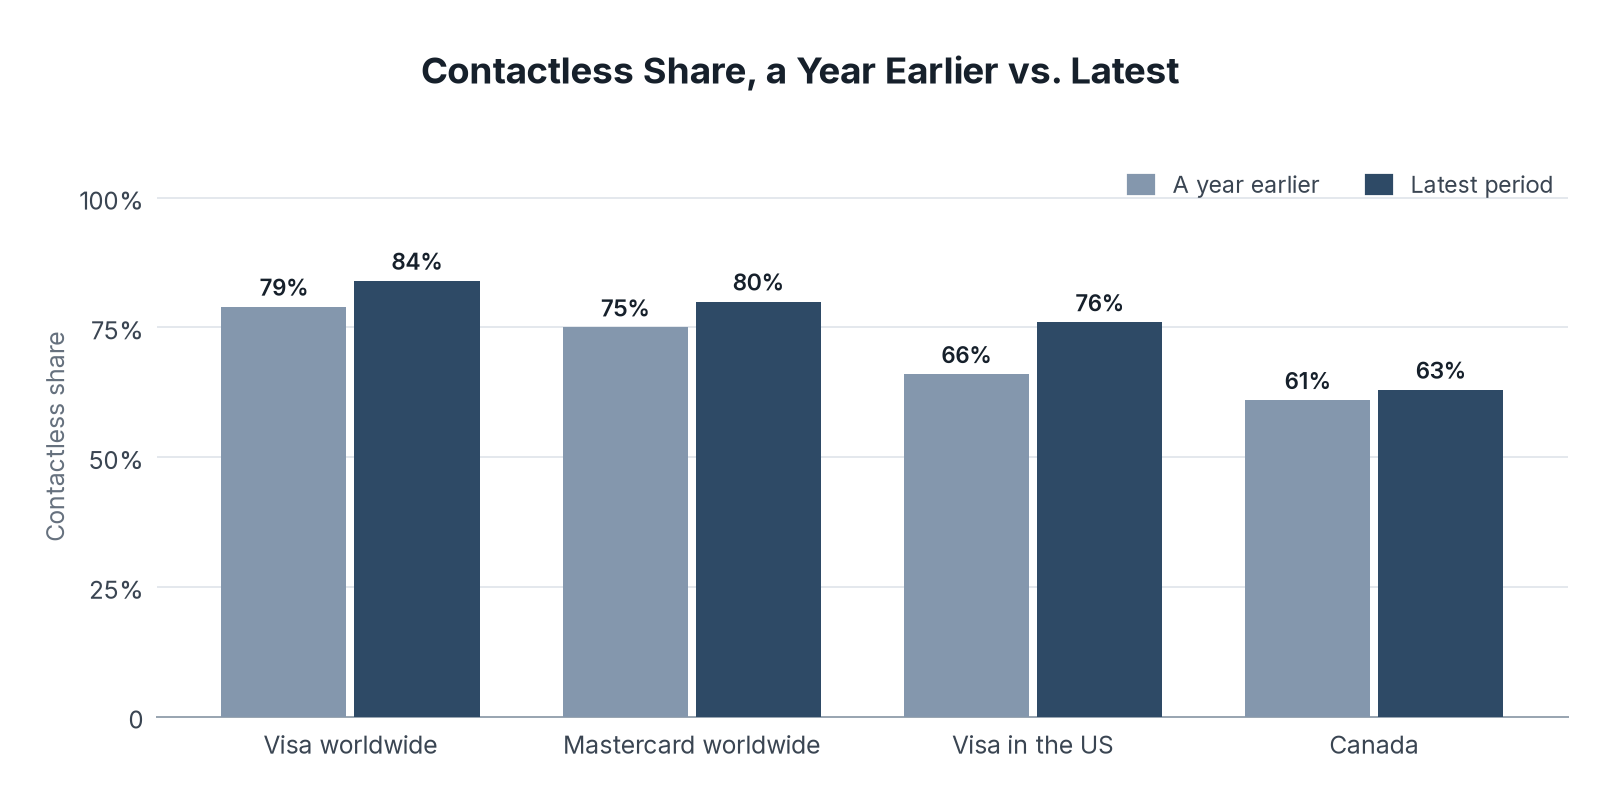
Contactless Share Rose in Every Market Over the Latest Year
The share of in-person payments made by tap rose by between 2 and 10 percentage points in the latest year, with the fastest growth in the US, where there was the most room to grow.
| Measure | A year earlier | Latest period |
|---|---|---|
| Visa worldwide | 79% | 84% |
| Mastercard worldwide | 75% | 80% |
| Visa in the US | 66% | 76% |
| Canada | 61% | 63% |
Key Findings
- Mastercard's contactless share of in-person switched purchases rose from 78% in Q1 2026 to 80% in Q2 2026, both up 5 points on the same quarter a year earlier.
- UK contactless payments rose from 18.9 billion in 2024 to 19.2 billion in 2025, and UK Finance expects them to reach 41% of all UK payments by 2035.
- 43% of Australian consumers used a mobile device to make a contactless payment in a survey week in 2025, up from 35% in 2022.
Tap to Pay Is Now the Default Way to Pay In Person
Tapping a card or phone is now the most common way to pay in shops across the markets we reviewed. The US, which trailed the rest of the world for years, now has three in four Visa in-person payments made by tap, and phones and watches are taking a growing share of those taps.
Looking ahead, the remaining growth is likely to come from mobile wallets and from places that still rely on chip and PIN or cash, such as small merchants and transit systems. Our digital wallet report and cash usage report track both sides of that shift.
So if you run a business that takes in-person payments, make sure every terminal accepts tap to pay from cards, phones, and watches, because three out of four Visa in-person payments in the US are now made that way.
Data Collection and Methodology
We reviewed sources available in Q4 2026. Visa figures come from the business section of Visa's Form 10-K for each fiscal year, which ends on September 30, and measure the share of face-to-face Visa transactions made by tapping a card or mobile device. Where Visa gave a floor, such as more than 40%, we show the floor in the chart and mark it with a plus sign. The September 2026 figures cover that month only.
Mastercard figures come from its Q1 and Q2 2026 earnings calls and cover in-person purchase transactions switched on Mastercard's network. Canadian figures come from the Bank of Canada's 2025 Methods-of-Payment Survey and cover all in-person payments, including cash. UK figures come from UK Finance's UK Payment Markets 2026 and cover all payments made in the UK. Australian figures come from the Reserve Bank of Australia's 2025 Consumer Payments Survey, and US mobile payment figures come from the Federal Reserve Bank of Atlanta's 2025 Survey and Diary of Consumer Payment Choice.
Because each source measures a different set of payments, the figures in the second chart are best compared within a source over time, as in the third chart.
Sources
- Fintech Index, Contactless Payment Study: analysis of card network filings and central bank payment surveys, conducted November 2026.
- Visa Inc., Form 10-K for fiscal 2026, November 5, 2026
- Visa Inc., Form 10-K annual reports for fiscal 2020 to fiscal 2025
- Mastercard, Q2 2026 earnings call
- Mastercard, Q1 2026 earnings call
- Bank of Canada, 2025 Methods-of-Payment Survey Report, Staff Analytical Paper 2026-36, August 2026
- UK Finance, UK Payment Markets 2026, August 19, 2026
- The Standard, Cash Expected to Make Up Just 4% of Payments by 2035 as Digital Innovation Grows, August 18, 2026
- Reserve Bank of Australia, Consumer Payment Behaviour in Australia, Bulletin, May 2026
- Federal Reserve Bank of Atlanta, 2025 Survey and Diary of Consumer Payment Choice: Summary Results
- Table 1: Source: Visa Inc., Form 10-K annual reports, fiscal 2020 to fiscal 2026. Data: visa_tap_to_pay_share_us.csv
- Chart 1: Source: Visa Inc., Form 10-K annual reports, fiscal 2020 to fiscal 2026.
- Table 2: Source: Visa Inc., Form 10-K, fiscal 2026; Mastercard, Q2 2026 earnings call; Bank of Canada, 2025 Methods-of-Payment Survey Report; UK Finance, UK Payment Markets 2026. Data: contactless_share_by_network_and_market.csv
- Chart 2: Source: Visa Inc., Form 10-K, fiscal 2026; Mastercard, Q2 2026 earnings call; Bank of Canada, 2025 Methods-of-Payment Survey Report; UK Finance, UK Payment Markets 2026.
- Table 3: Source: Visa Inc., Form 10-K, fiscal 2025 and fiscal 2026; Mastercard, Q2 2026 earnings call; Bank of Canada, 2025 Methods-of-Payment Survey Report. Data: contactless_share_prior_vs_latest.csv
- Chart 3: Source: Visa Inc., Form 10-K, fiscal 2025 and fiscal 2026; Mastercard, Q2 2026 earnings call; Bank of Canada, 2025 Methods-of-Payment Survey Report.