Buy Now, Pay Later Usage Statistics: 2026 Report

Our analysts reviewed the Federal Reserve's Survey of Household Economics and Decisionmaking for 2021 through 2025, Affirm's results for fiscal 2026, and Klarna's results for the second quarter of 2026, as of Q4 2026. We charted how many US adults use buy now, pay later, how often users pay late, who uses it most, and why they choose it.
Buy now, pay later, or BNPL, lets a shopper split a purchase into a small number of equal payments, usually four, often with no interest. A $100 purchase might be paid as $25 at checkout and three more payments of $25 every two weeks.
Key Findings
- 16% of US adults used BNPL in 2025, up from 10% in 2021.
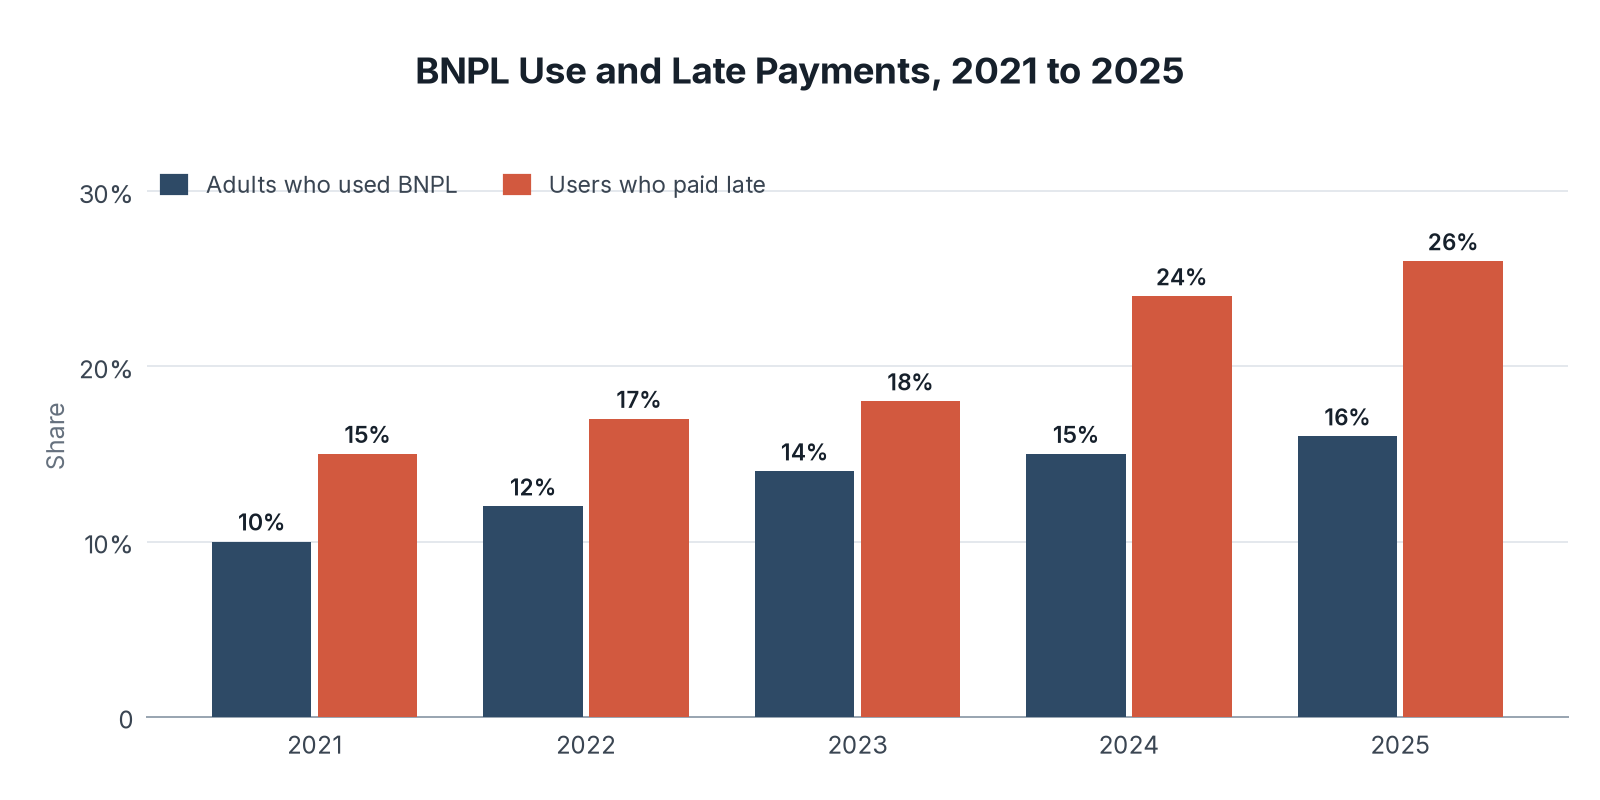
- 26% of BNPL users paid late at least once in 2025, up from 15% in 2021.
- 23% of adults with family income of $25,000 to $49,999 and 29% of Black adults used BNPL in 2025, against 12% of adults earning $100,000 or more.
- Affirm processed $50.2 billion in gross merchandise volume in fiscal 2026, up 37% from $36.7 billion, and its active consumers rose to 27.8 million.
BNPL Use Rose From 10% to 16% of US Adults in Four Years
The share of adults using BNPL grew every year after the Federal Reserve first asked about it in 2021. The share of users who paid late grew faster, and the biggest jump came in 2024, from 18% to 24%.
| Year | Adults who used BNPL | Users who paid late |
|---|---|---|
| 2021 | 10% | 15% |
| 2022 | 12% | 17% |
| 2023 | 14% | 18% |
| 2024 | 15% | 24% |
| 2025 | 16% | 26% |
Key Findings
- 64% of BNPL users who paid late in 2025 were charged extra for it, which equals 17% of all BNPL users.
- 11% of BNPL users had a BNPL payment trigger an overdraft or non-sufficient funds fee from their bank in 2025.
- Affirm's active consumers grew from 18.7 million in June 2024 to 23.0 million in June 2025 and 27.8 million in June 2026, and each made 7.0 transactions on average in fiscal 2026, up from 4.9 two years earlier.
Middle-Income and Younger Adults Use BNPL the Most
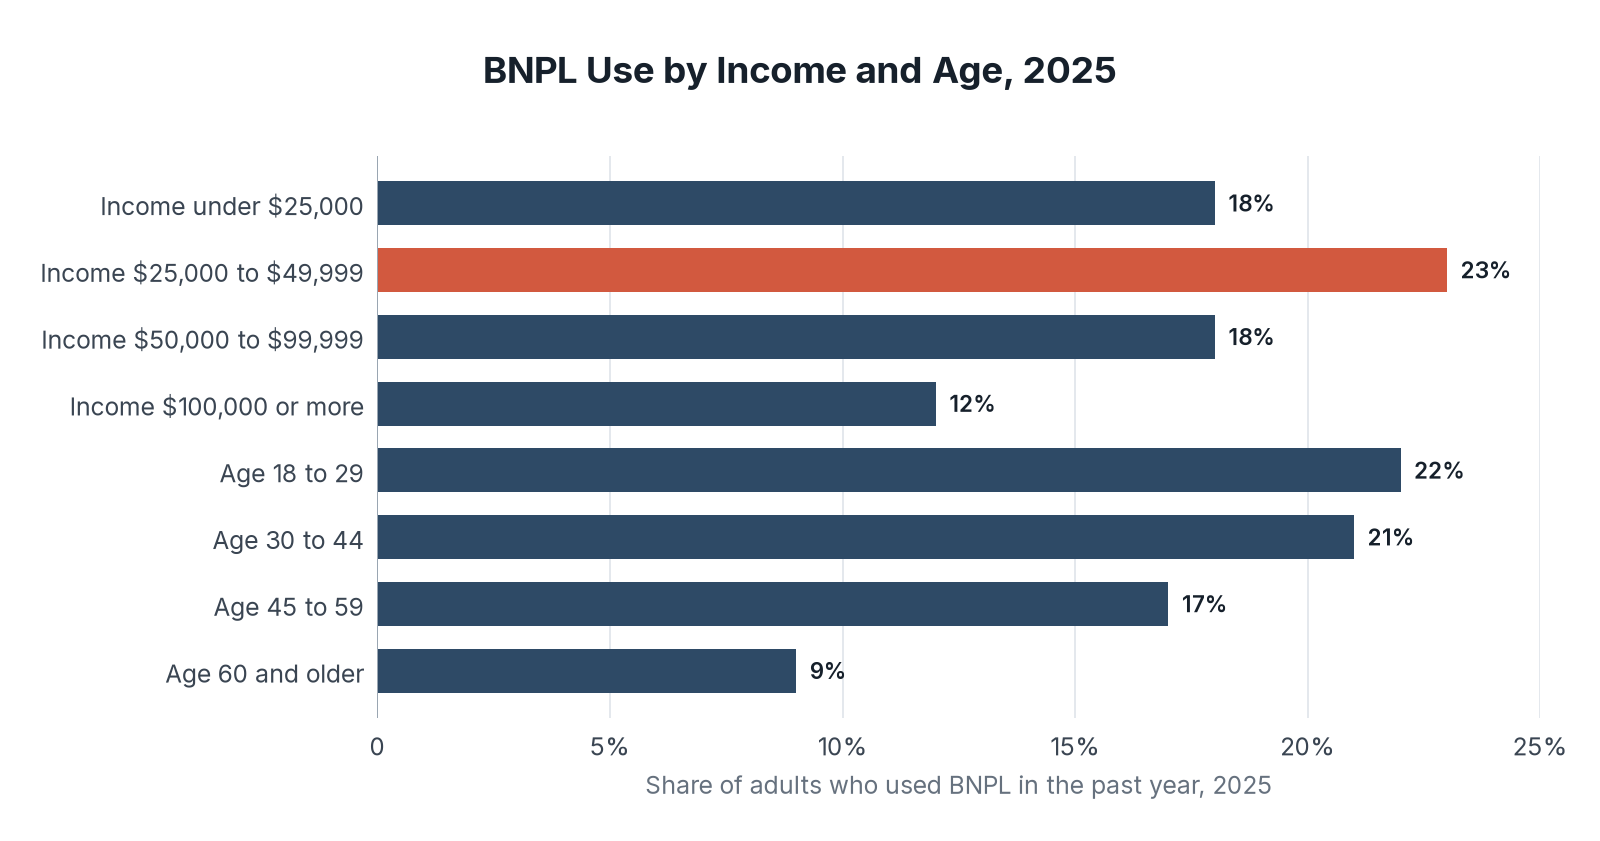
BNPL use peaked among adults earning $25,000 to $49,999 in 2025, at 23%, and it fell with age, from 22% of adults under 30 to 9% of adults aged 60 and older. Late payment followed income more closely, at 40% of users earning under $25,000 against 11% of users earning $100,000 or more.
| Group | Category | Used BNPL | Users who paid late |
|---|---|---|---|
| Family income | Under $25,000 | 18% | 40% |
| Family income | $25,000 to $49,999 | 23% | 33% |
| Family income | $50,000 to $99,999 | 18% | 25% |
| Family income | $100,000 or more | 12% | 11% |
| Age | 18 to 29 | 22% | 32% |
| Age | 30 to 44 | 21% | 31% |
| Age | 45 to 59 | 17% | 22% |
| Age | 60 and older | 9% | 12% |
Key Findings
- 29% of Black adults and 26% of Hispanic adults used BNPL in 2025, more than twice the rate for White adults (12%) and Asian adults (11%).
- 19% of women used BNPL in 2025, compared with 14% of men.
- 49% of BNPL users bought clothing or accessories with it in 2025, 32% bought electronics, 26% bought furniture or appliances, and 20% paid for groceries or food delivery.
Lower-Income Users Choose BNPL Because It Is the Only Way to Afford a Purchase
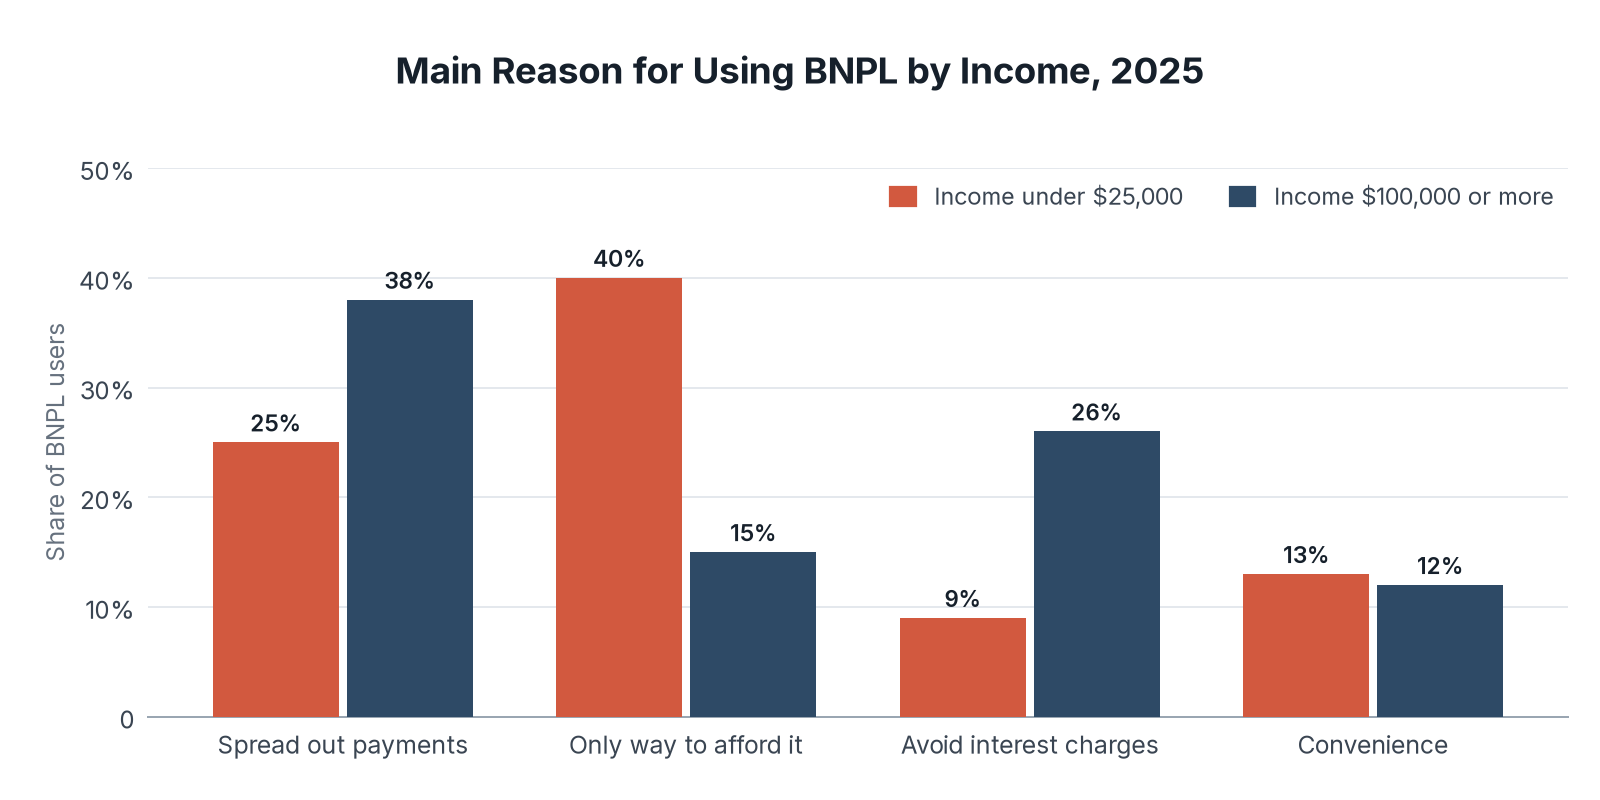
Across all users, the most common main reason for using BNPL in 2025 was to spread out payments (31%), followed by "only way I could afford it" (29%). The answers split by income: 40% of users earning under $25,000 said BNPL was the only way to afford the purchase, while users earning $100,000 or more most often wanted to spread out payments or avoid interest.
| Main reason | Income under $25,000 | Income $100,000 or more | All users |
|---|---|---|---|
| Wanted to spread out payments | 25% | 38% | 31% |
| Only way I could afford it | 40% | 15% | 29% |
| Avoid interest charges | 9% | 26% | 16% |
| Convenience | 13% | 12% | 12% |
Key Findings
- 4% of BNPL users said their main reason was that they did not want to use a credit card, and 2% wanted a fixed number of payments.
- Klarna processed $36.6 billion in gross merchandise volume in Q2 2026, up 18% from $31.2 billion a year earlier, and had 120 million active consumers, up from 111 million.
- Klarna's US volume grew 27% to $7.9 billion in Q2 2026, or 22% of its total, and its pay-in-installments product for larger purchases grew 82% to $4.7 billion.
BNPL Is Now a Regular Way to Pay for One in Six Adults
One in six US adults used BNPL in 2025, and the users who rely on it most are those with the least room in their budgets. More than a quarter of users paid late at least once, and for users earning under $25,000 the share was 40%.
The providers' own numbers point the same way. Affirm's volume passed $50 billion in fiscal 2026, its users made more transactions each year, and Klarna's US volume grew faster than the rest of its business. Our BNPL default rate report and overdraft fee report cover what happens when those payments are missed.
So if you offer BNPL at checkout, show the payment dates and any late fees as clearly as the price, because one in four users paid late in 2025.
Data Collection and Methodology
We reviewed sources available in Q4 2026. Usage, late payment, demographic, reason, and purchase figures come from the Federal Reserve's Survey of Household Economics and Decisionmaking, published each May, which asks adults whether they used BNPL in the prior 12 months. The 2025 figures come from the report published in May 2026, and earlier years come from the same series as shown in that report.
Late payment shares count BNPL users who said they paid late at least once in the prior 12 months. Reasons for using BNPL count each user's main reason only. Affirm figures come from its fiscal fourth quarter 2026 shareholder letter, for the year ended June 30, 2026, and count active consumers as people who made at least one transaction in the prior 12 months. Klarna figures come from its Q2 2026 earnings release and are in US dollars as published.
Sources
- Fintech Index, Buy Now, Pay Later Usage Study: analysis of Federal Reserve survey data and provider results, conducted November 2026.
- Board of Governors of the Federal Reserve System, Economic Well-Being of US Households in 2025: Credit, May 2026
- Board of Governors of the Federal Reserve System, Economic Well-Being of US Households in 2025: Accessible Version, May 2026
- Affirm Holdings, Fiscal Fourth Quarter 2026 Shareholder Letter, August 27, 2026
- Klarna Group, Q2 2026 Earnings Release, August 18, 2026
- Table 1: Source: Board of Governors of the Federal Reserve System, Economic Well-Being of US Households in 2025, May 2026. Data: shed_bnpl_use_and_late_payment_by_year.csv
- Chart 1: Source: Board of Governors of the Federal Reserve System, Economic Well-Being of US Households in 2025, May 2026.
- Table 2: Source: Board of Governors of the Federal Reserve System, Economic Well-Being of US Households in 2025, May 2026. Data: shed_bnpl_use_by_income_and_age_2025.csv
- Chart 2: Source: Board of Governors of the Federal Reserve System, Economic Well-Being of US Households in 2025, May 2026.
- Table 3: Source: Board of Governors of the Federal Reserve System, Economic Well-Being of US Households in 2025, May 2026. Data: shed_bnpl_main_reason_by_income_2025.csv
- Chart 3: Source: Board of Governors of the Federal Reserve System, Economic Well-Being of US Households in 2025, May 2026.