Auto Loan Delinquency Statistics: 2026 Report

Our analysts reviewed the Federal Reserve Bank of New York's Quarterly Report on Household Debt and Credit for the third quarter of 2026, built on credit records from the New York Fed Consumer Credit Panel and Equifax, with quarterly data from 2003 through Q3 2026, as of Q4 2026. We charted how much auto debt is seriously late, which age groups fall behind fastest, and how lending has shifted by credit score.
A loan is seriously delinquent once a payment is 90 or more days late. The New York Fed reports this 90-day mark as serious delinquency, and it is the measure this report tracks.
Key Findings
- 5.66% of auto loan balances were 90 or more days delinquent in Q3 2026, the highest share since the series began in 2003.
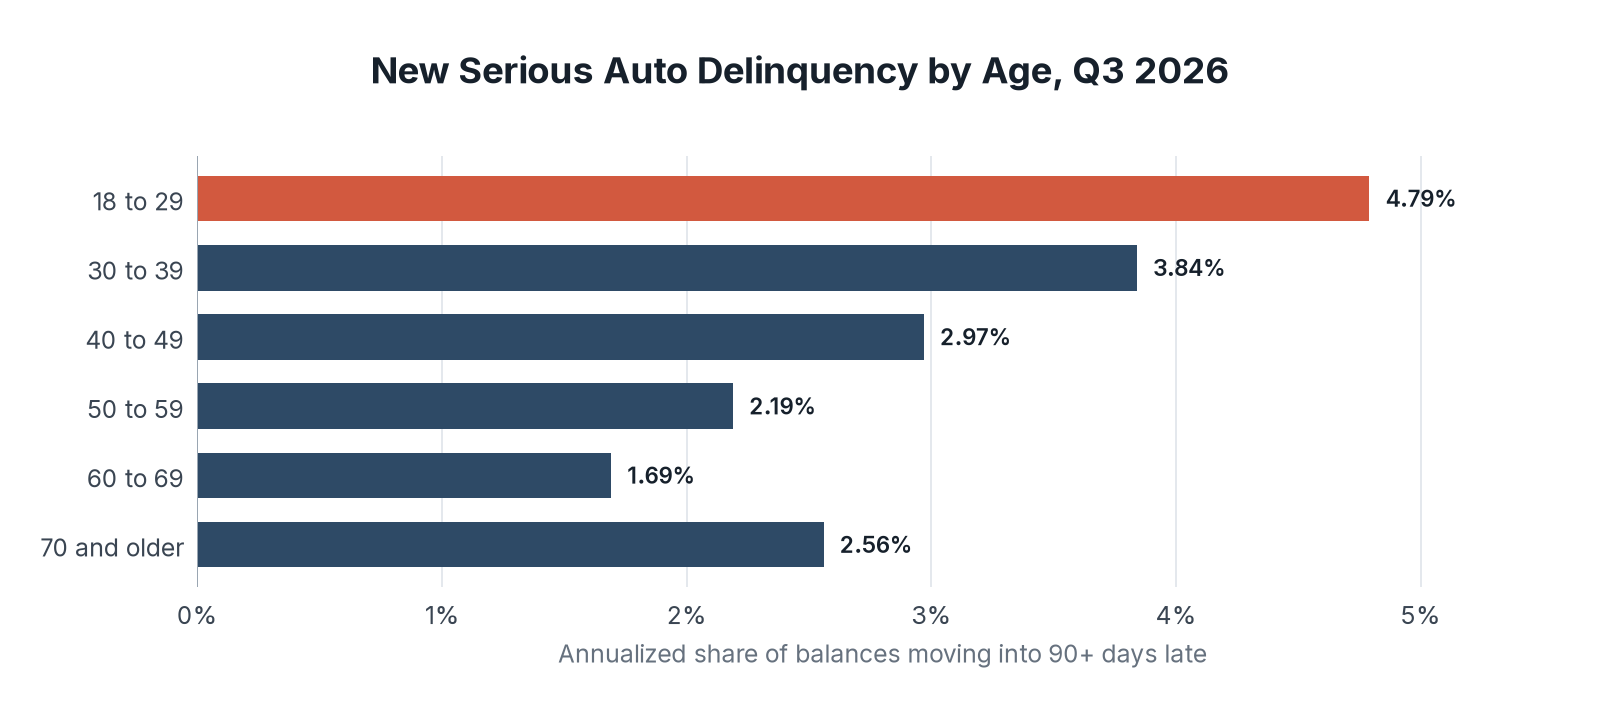
- Borrowers aged 18 to 29 moved into serious delinquency at an annualized rate of 4.79%, 2.8 times the 1.69% rate for borrowers aged 60 to 69.
- Lenders originated $34.9 billion of auto loans to borrowers with credit scores under 620 in Q3 2026, up 27% from $27.6 billion a year earlier.
- Auto loan balances reached $1.73 trillion across 108.5 million accounts in Q3 2026.
Seriously Late Auto Debt Has Risen for Three Straight Years
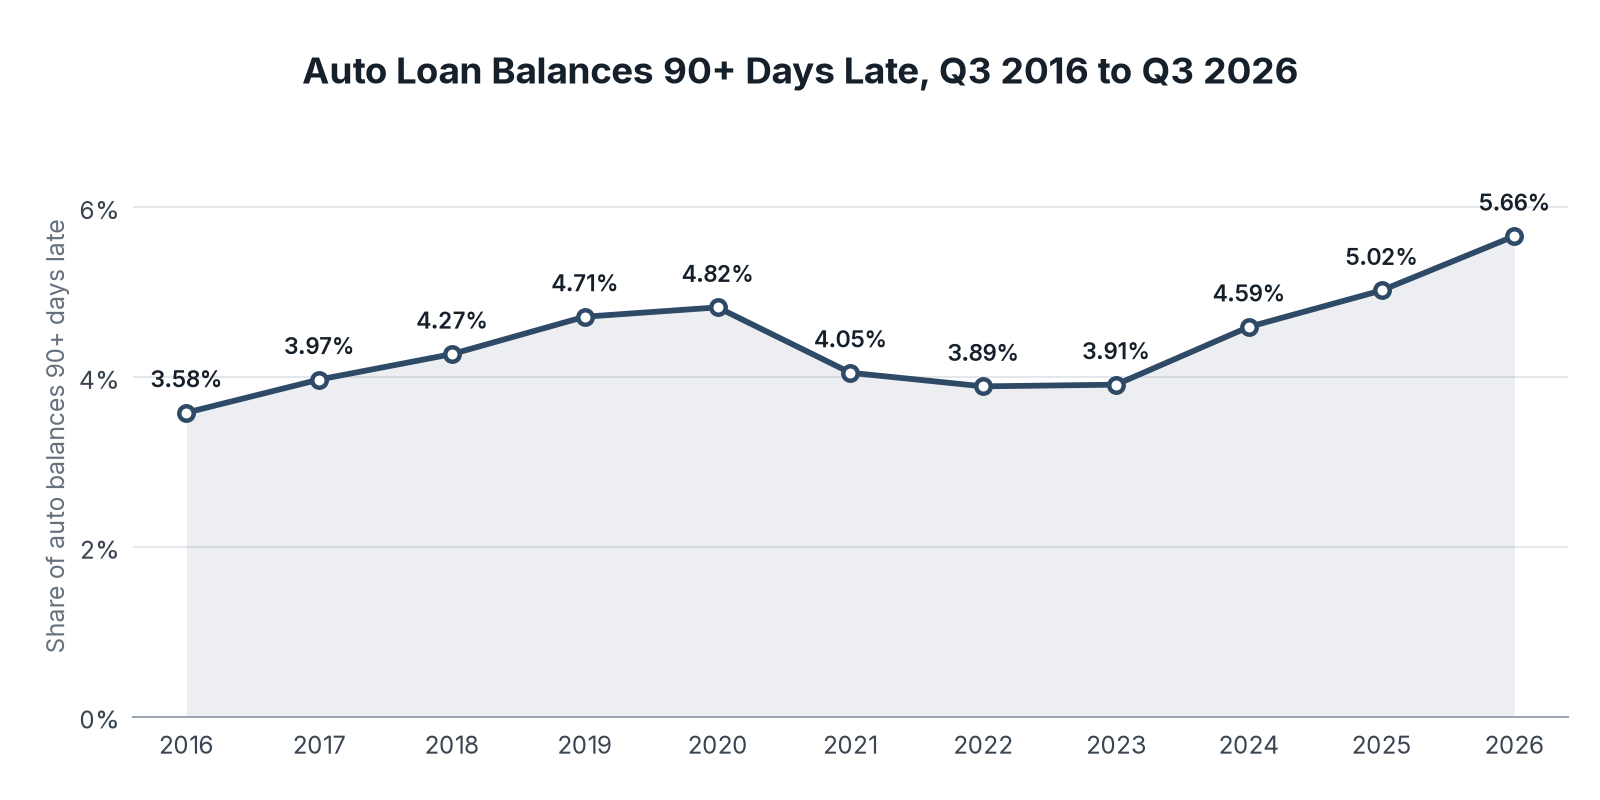
The share of auto balances 90 or more days late held near 4% from 2021 to 2023, then climbed each year. By Q3 2026 it stood at 5.66%, up from 5.02% a year earlier and higher than the 5.03% reached in Q3 2011, after the financial crisis.
| Quarter | Share of auto balances 90+ days late |
|---|---|
| Q3 2016 | 3.58% |
| Q3 2017 | 3.97% |
| Q3 2018 | 4.27% |
| Q3 2019 | 4.71% |
| Q3 2020 | 4.82% |
| Q3 2021 | 4.05% |
| Q3 2022 | 3.89% |
| Q3 2023 | 3.91% |
| Q3 2024 | 4.59% |
| Q3 2025 | 5.02% |
| Q3 2026 | 5.66% |
Key Findings
- The 90+ day share rose 1.75 percentage points from 3.91% in Q3 2023 to 5.66% in Q3 2026.
- An annualized 7.96% of auto balances moved into 30 or more days late in Q3 2026, up from 7.79% a year earlier.
- Credit cards at 12.90%, student loans at 10.92%, and other consumer loans at 9.63% had higher 90+ day shares than auto loans in Q3 2026.
Borrowers Under 30 Fall Behind at the Fastest Rate
The transition rate shows how much auto debt newly became 90 or more days late over the past year. It falls steadily with age through the 60s, then rises again for borrowers aged 70 and older.
| Age | Annualized share of balances moving into 90+ days late |
|---|---|
| 18 to 29 | 4.79% |
| 30 to 39 | 3.84% |
| 40 to 49 | 2.97% |
| 50 to 59 | 2.19% |
| 60 to 69 | 1.69% |
| 70 and older | 2.56% |
Key Findings
- Across all ages, 3.02% of auto balances moved into serious delinquency over the year to Q3 2026, compared with 2.99% a year earlier.
- Borrowers aged 70 and older reached 2.56% in Q3 2026, up from 1.95% in Q3 2025, the largest increase of any age group.
- Borrowers aged 18 to 29 took out $31.5 billion of new auto loans in Q3 2026, compared with $48.4 billion for borrowers aged 40 to 49.
Lending to Lower Credit Scores Grew Fastest
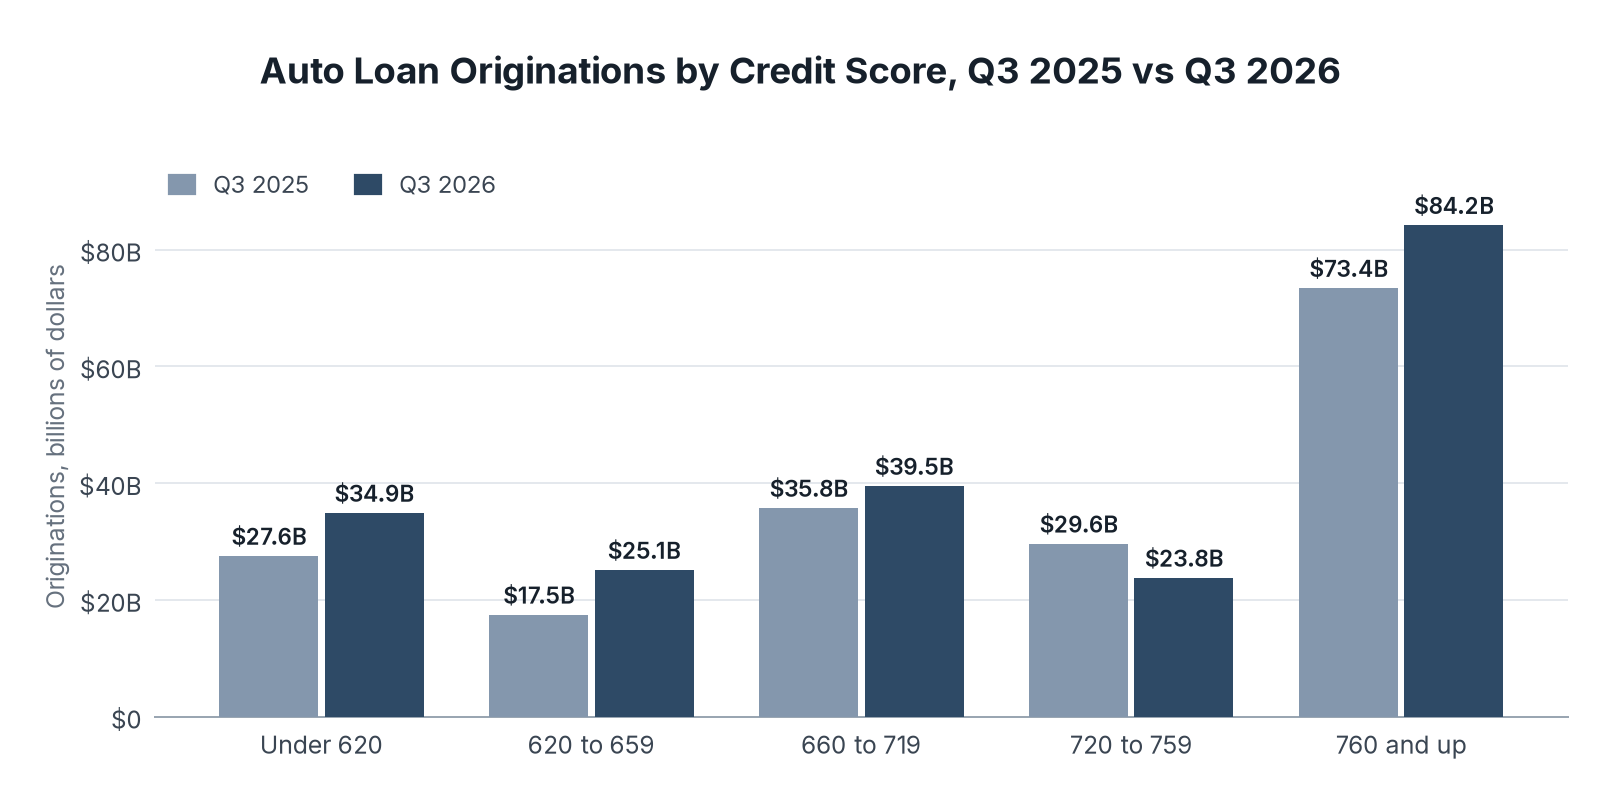
Lenders wrote $207.6 billion of auto loans in Q3 2026, up 13% from $183.9 billion a year earlier. The fastest growth came in the two lowest credit score bands, while lending to borrowers with scores of 720 to 759 fell.
| Credit score | Q3 2025 | Q3 2026 |
|---|---|---|
| Under 620 | $27.6B | $34.9B |
| 620 to 659 | $17.5B | $25.1B |
| 660 to 719 | $35.8B | $39.5B |
| 720 to 759 | $29.6B | $23.8B |
| 760 and up | $73.4B | $84.2B |
Key Findings
- Borrowers with scores under 620 received 16.8% of new auto lending in Q3 2026, up from 15.0% a year earlier.
- Originations to borrowers with scores of 620 to 659 rose 44%, from $17.5 billion to $25.1 billion.
- The median credit score on a new auto loan was 718 in Q3 2026, down from 724 a year earlier, and the 25th percentile fell from 649 to 639.
How Auto Debt Fits Into Household Credit
Auto loans are the second largest household debt after mortgages, ahead of student loans at $1.66 trillion. Their balance grew faster over the year than total household debt.
| Measure | Q3 2025 | Q3 2026 |
| --- | --- | --- |
| Auto loan balance | $1.66 trillion | $1.73 trillion |
| Total household debt | $18.58 trillion | $19.10 trillion |
| Auto loan accounts | 105.9 million | 108.5 million |
| Share of auto balances 90+ days late | 5.02% | 5.66% |
| Annualized share moving into 30+ days late | 7.79% | 7.96% |
| Median credit score at origination | 724 | 718 |
Key Findings
- Auto loan balances grew 4.8% over the year, compared with 2.8% for total household debt.
- The number of auto loan accounts rose by 2.6 million, from 105.9 million to 108.5 million.
- Auto debt made up 9.1% of total household debt in Q3 2026.
What Rising Auto Delinquency Means for Borrowers
The data points to strain concentrated among younger borrowers and those with weaker credit. Serious delinquency is at a record share of balances, and lenders expanded lending fastest to the score bands most likely to fall behind.
Many of the loans made to borrowers with scores under 660 in 2026 have not yet had time to fall behind, so their performance will shape late payment rates through 2027. The New York Fed's fourth quarter report, due in early 2027, will show whether the 90+ day share keeps rising.
So if you are shopping for a car loan, compare the full monthly payment with your budget before you sign, because a missed payment can turn into a serious delinquency within three months.
Data Collection and Methodology
We reviewed sources available in Q4 2026. All figures come from the data workbook for the Federal Reserve Bank of New York's Quarterly Report on Household Debt and Credit, 2026 Q3, which draws on the New York Fed Consumer Credit Panel and Equifax credit records. Delinquency shares are the percent of auto loan balances 90 or more days late at the end of each quarter. Transition rates by age are four-quarter moving sums of the share of balances that moved from current or early delinquency into 90 or more days late. Originations are new auto loans by credit score at origination. We used third-quarter values to compare the same quarter across years.
Sources
- Fintech Index, Auto Loan Delinquency Study: analysis of New York Fed household credit data on auto loan balances, delinquency, and originations from 2016 to Q3 2026, conducted November 2026.
- Federal Reserve Bank of New York, Quarterly Report on Household Debt and Credit, 2026 Q3
- Federal Reserve Bank of New York, Household Debt and Credit Report data, 2026 Q3
- Table 1: Source: Federal Reserve Bank of New York, Quarterly Report on Household Debt and Credit, 2026 Q3. Data: nyfed_auto_balance_90_plus_days_late_q3_2016_2026.csv
- Chart 1: Source: Federal Reserve Bank of New York, Quarterly Report on Household Debt and Credit, 2026 Q3.
- Table 2: Source: Federal Reserve Bank of New York, Quarterly Report on Household Debt and Credit, 2026 Q3. Data: nyfed_auto_serious_delinquency_by_age_q3_2026.csv
- Chart 2: Source: Federal Reserve Bank of New York, Quarterly Report on Household Debt and Credit, 2026 Q3.
- Table 3: Source: Federal Reserve Bank of New York, Quarterly Report on Household Debt and Credit, 2026 Q3. Data: nyfed_auto_originations_by_credit_score_q3_2025_2026.csv
- Chart 3: Source: Federal Reserve Bank of New York, Quarterly Report on Household Debt and Credit, 2026 Q3.
- Table 3: Source: Federal Reserve Bank of New York, Quarterly Report on Household Debt and Credit, 2026 Q3. Data: nyfed_auto_originations_by_credit_score_q3_2025_2026.csv