401(k) Balance by Age Statistics: 2026 Report

Our analysts reviewed Vanguard's How America Saves 2026, which reports account balances for its defined contribution plans at the end of 2025, and Fidelity's Q2 2026 retirement analysis of more than 55 million retirement accounts, as of Q4 2026. We charted how balances change with age, income, and years with an employer, and compared the average with the median.
The average adds every balance and divides by the number of accounts, so a few very large accounts pull it up. The median is the middle account, which is a better guide to the typical saver.
Key Findings
- The average Vanguard 401(k) balance was $167,970 at the end of 2025, while the median was $44,115.
- Balances by age ran from a $2,234 median for savers under 25 to a $107,269 median for savers aged 55 to 64.
- The median balance for savers earning $150,000 or more was $230,536, which is 66 times the median for savers earning under $15,000.
- Fidelity put the average 401(k) balance at $155,800 in the second quarter of 2026, up 13% from a year earlier.
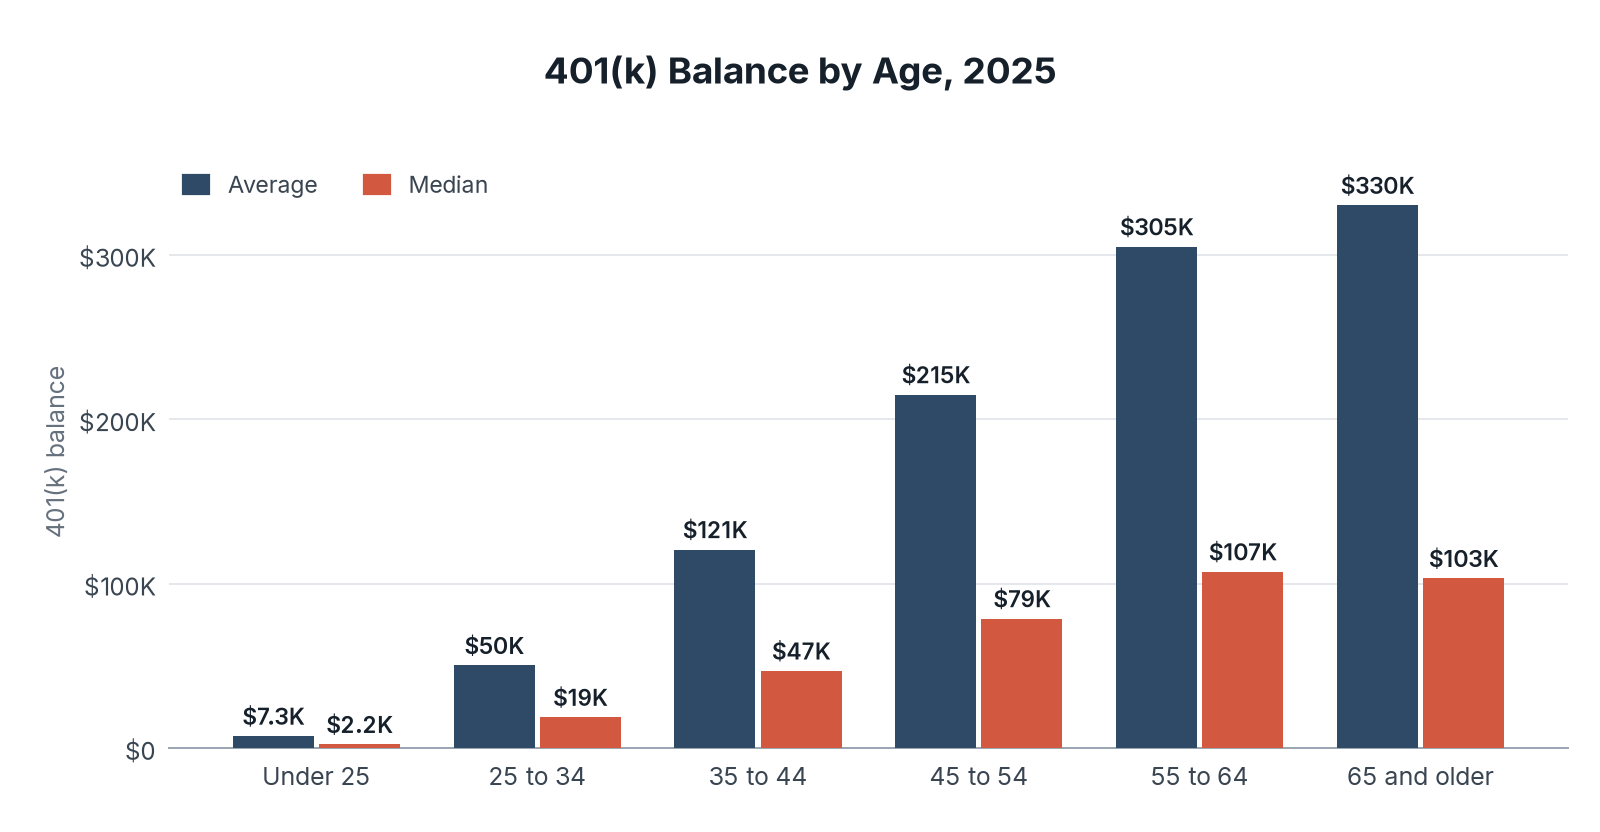
The Median 401(k) Balance Peaks Near $107,000 at Ages 55 to 64
The average balance climbs with age to $330,186 for savers aged 65 and older. The median stops rising after 55 to 64 and was slightly lower, at $103,202, for savers aged 65 and older.
| Age | Average balance | Median balance |
|---|---|---|
| Under 25 | $7,259 | $2,234 |
| 25 to 34 | $50,261 | $18,732 |
| 35 to 44 | $120,742 | $46,919 |
| 45 to 54 | $214,991 | $78,730 |
| 55 to 64 | $305,006 | $107,269 |
| 65 and older | $330,186 | $103,202 |
Key Findings
- The average balance was between 2.6 and 3.2 times the median at every age from 25 and up, because large accounts lift the average.
- A saver aged 35 to 44 had a median of $46,919, and a saver aged 45 to 54 had a median of $78,730.
- Men had an average balance of $194,597 and a median of $52,309, while women had an average of $146,476 and a median of $42,139.
Income Moves the Balance More Than Any Other Factor
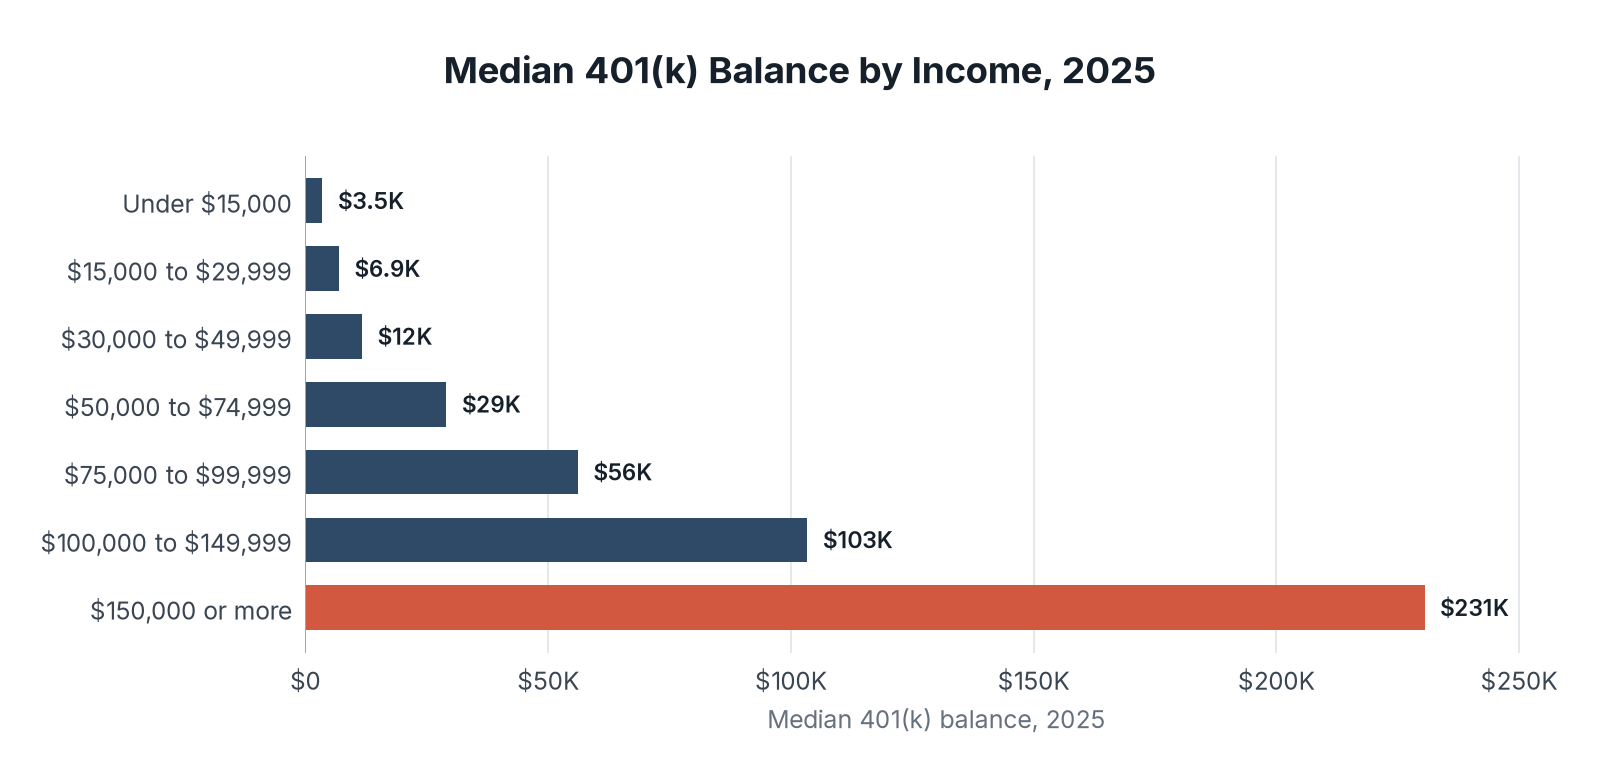
Income, age, and tenure are intertwined, because higher earners can afford to save more. The median balance for savers earning $150,000 or more was $230,536, and for savers earning under $15,000 it was $3,489.
| Income | Median balance |
|---|---|
| Under $15,000 | $3,489 |
| $15,000 to $29,999 | $6,896 |
| $30,000 to $49,999 | $11,659 |
| $50,000 to $74,999 | $29,033 |
| $75,000 to $99,999 | $56,115 |
| $100,000 to $149,999 | $103,396 |
| $150,000 or more | $230,536 |
Key Findings
- The median balance roughly doubled with each step up in income between the $50,000 to $74,999 band and the $100,000 to $149,999 band.
- Savers earning $100,000 to $149,999 had an average balance of $198,912, 1.7 times the $114,670 average for savers earning $75,000 to $99,999.
- The median participant earned $90,000, against $42,000 for the median nonparticipant.
Savers With Ten Years at One Employer Hold a Median of $186,000
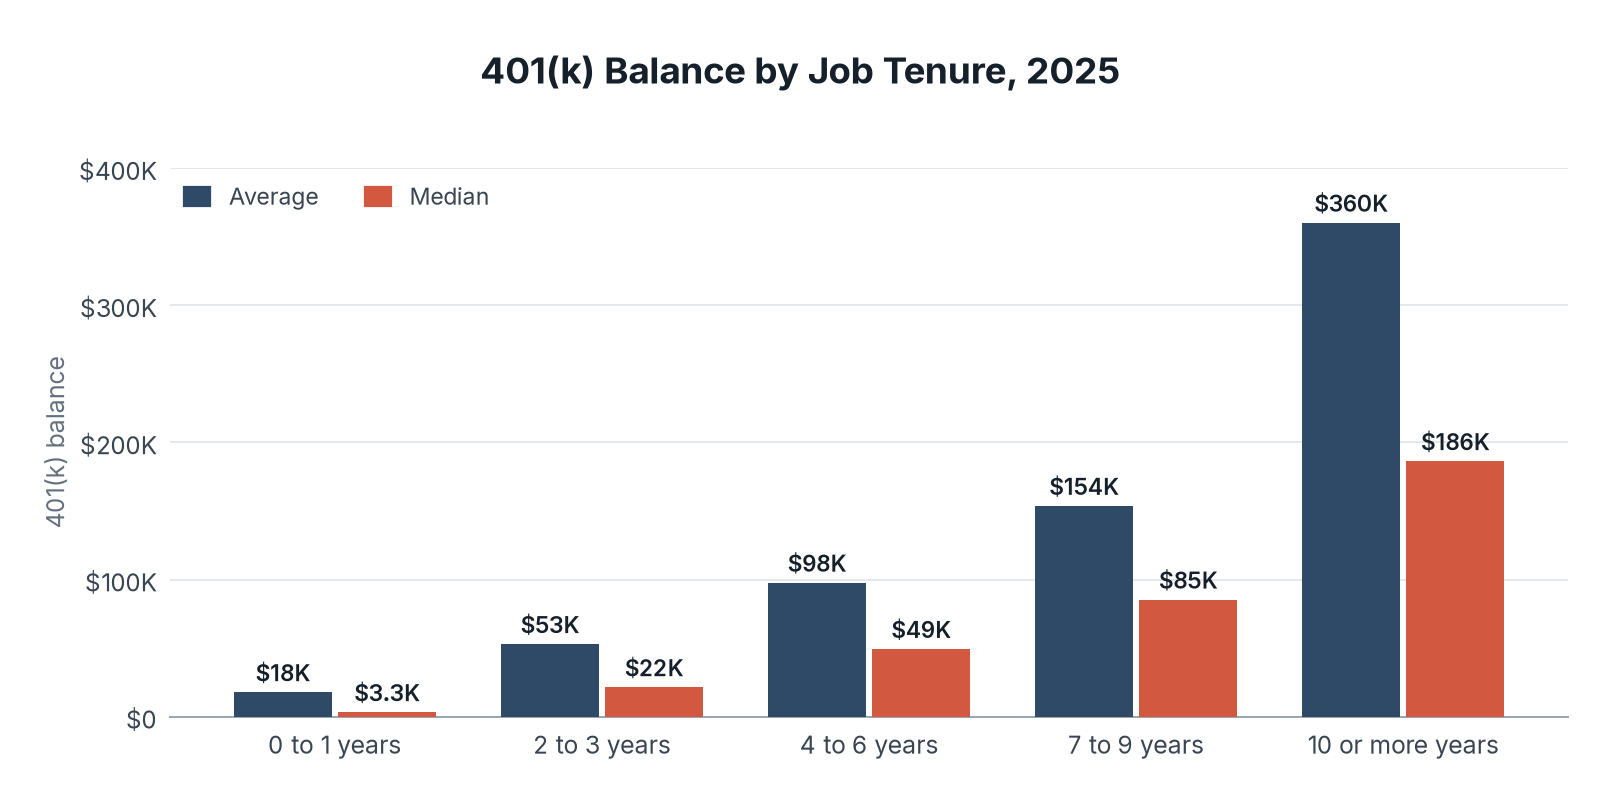
Years with the same employer track balances closely, because longer tenure brings higher pay, steadier contributions, and more years of match. Savers with 10 or more years of tenure had a median balance of $186,335.
| Years with employer | Average balance | Median balance |
|---|---|---|
| 0 to 1 years | $17,865 | $3,327 |
| 2 to 3 years | $52,956 | $21,504 |
| 4 to 6 years | $97,752 | $49,403 |
| 7 to 9 years | $153,745 | $85,393 |
| 10 or more years | $360,255 | $186,335 |
Key Findings
- The median balance for savers with 10 or more years of tenure was 56 times the median for savers in their first year or two.
- In plans with automatic enrollment, savers with 10 or more years of tenure had median balances about 65% higher than similar savers in plans where employees must sign up themselves.
- The median participant had 6 years of tenure and was 43 years old.
How Much Savers Put In
Savers added to their balances at record rates. Vanguard's participants deferred an average of 7.6% of pay in 2025, and with employer money the average total contribution rate was 12.1%. At Fidelity the average total savings rate was 14.4% in the second quarter of 2026, made up of a record 9.6% from employees and 4.8% from employers.
| Measure | Result |
| --- | --- |
| Average Vanguard deferral rate, 2025 | 7.6% |
| Median Vanguard deferral rate, 2025 | 6.6% |
| Average total contribution rate at Vanguard, 2025 | 12.1% |
| Participation in plans with automatic enrollment | 94% |
| Participation in plans where employees must sign up | 64% |
| Vanguard plans with automatic enrollment | 61% |
| Average total savings rate at Fidelity, Q2 2026 | 14.4% |
| Fidelity savers who earned the full employer match | 81.2% |
Key Findings
- Participation was 94% in plans with automatic enrollment and 64% in plans without it, a gap of 30 percentage points.
- 25% of Vanguard participants deferred more than 10% of pay, and 14% reached the federal contribution limit of $23,500.
- Among Vanguard participants who held an account at both the end of 2024 and the end of 2025, the median balance rose 27% and 94% saw a gain.
What the Numbers Mean for a Saver
Balances by age mix income and tenure, so they are a rough guide. The contribution rate is the better one: Vanguard's participants averaged 12.1% of pay including employer money, and balances rise with every year in the plan.
Fidelity found that women who had saved continuously in a 401(k) for at least five years held an average balance of $273,400 in the second quarter of 2026, above the overall Fidelity average of $155,800.
So if you are comparing yourself with these figures, compare the median for your age first, then check your savings rate and years in the plan.
Data Collection and Methodology
We reviewed sources available in Q4 2026. Vanguard figures come from How America Saves 2026, the 25th edition, which reports year-end 2025 data for defined contribution plans that Vanguard keeps records for, covering 4.6 million participant accounts. Figures include 401(k), 403(b), and other defined contribution accounts in those plans. Balances are for the plan account only and do not include IRAs or accounts held elsewhere. Fidelity figures come from its Q2 2026 Retirement Analysis of more than 55 million accounts. The two firms serve different employers, so their averages differ and are best read within each source.
Sources
- Fintech Index, 401(k) Balance Study: analysis of Vanguard and Fidelity retirement account data, conducted November 2026.
- Vanguard, How America Saves 2026
- Fidelity Investments, Q2 2026 Retirement Analysis
- Table 1: Source: Vanguard, How America Saves 2026. Data: vanguard_401k_balance_by_age_2025.csv
- Chart 1: Source: Vanguard, How America Saves 2026.
- Table 2: Source: Vanguard, How America Saves 2026. Data: vanguard_401k_median_balance_by_income_2025.csv
- Chart 2: Source: Vanguard, How America Saves 2026.
- Table 3: Source: Vanguard, How America Saves 2026. Data: vanguard_401k_balance_by_tenure_2025.csv
- Chart 3: Source: Vanguard, How America Saves 2026; Fidelity, Q2 2026 Retirement Analysis.
- Table 3: Source: Vanguard, How America Saves 2026; Fidelity, Q2 2026 Retirement Analysis. Data: vanguard_401k_balance_by_tenure_2025.csv